Stress-Strain Curve is a graphical plot of a material’s Stress and its Strain. Stress is plotted on the Y-Axis and Strain is plotted on the X-axis. This Stress and Strain curve provides the relation between stress and strain and the material’s stress behavior with an increase in strain. In material science and mechanical engineering, the stress-strain curve is widely used to understand the strength, deformation, and failure criteria of any material. In this article, we will explore details about the stress-strain curve.
Generation of Stress-Strain Curve
The Stress-Strain curve is plotted during the tensile test of a test specimen inside the Universal Testing Machine (UTM). In that instrument, the force on the standard specimen is increased till its failure and a plotter keeps recording the stress and strain.
Fig. 1 shows a typical stress-strain curve of Steel.
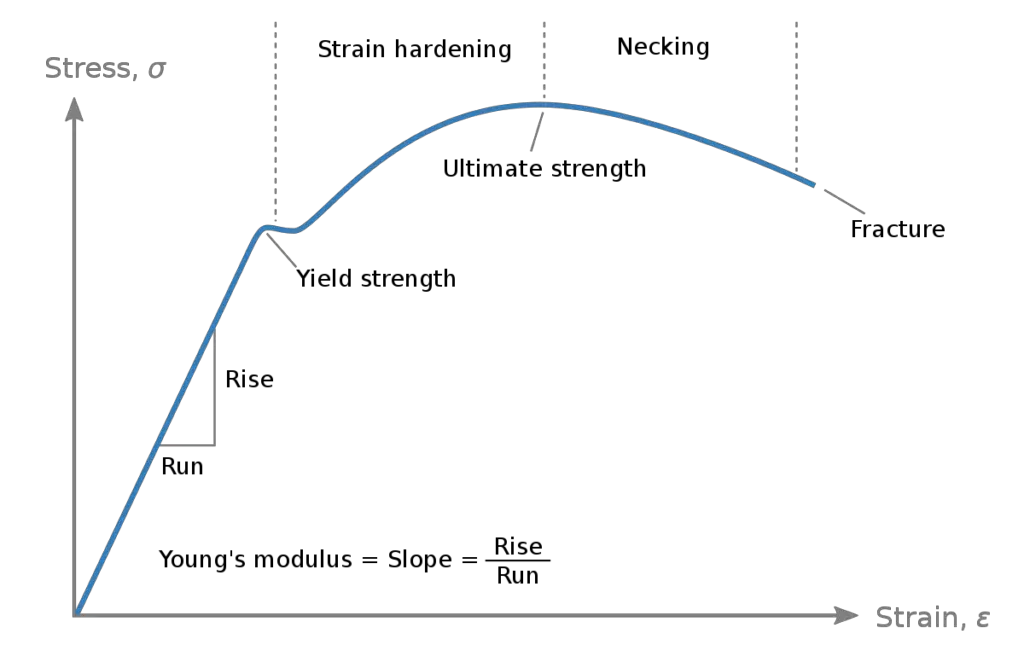
The stress & strain curve shown above describes various engineering parameters as listed below:
Yield Strength:
The Yield Strength of a material is the maximum stress after which the elongation becomes plastic and permanent deformation starts. Once the yield strength of a material is reached, large deformation occurs with very little increase in the applied load. The material will regain its shape once the stress is removed if the yield point is not reached.
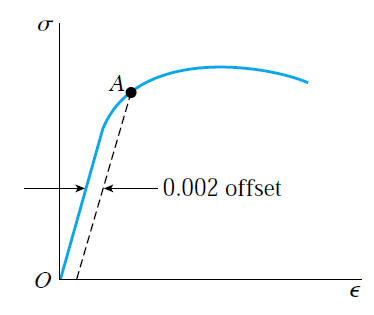
In the stress-strain curve, yield strength is the point from where the stress deviates its proportionality to strain. For a few materials, the yield strength in the stress-strain curve is distinct but for a few others, it is not. Hence, a concept of proof stress is used to denote the yield strength in the stress & strain curve for those materials. Proof Stress is indicated by drawing a parallel line to the linear portion of the stress-strain curve at a strain value of 0.002 (or 2%).
Ultimate Tensile Strength:
The ultimate tensile strength or tensile strength of a material is the maximum stress value of the stress-strain curve. This is the maximum stress value for any material before final failure. For brittle materials, tensile strength is used as a stress basis in design calculations. In the stress-strain curve, the ultimate tensile strength can be decided accurately for all types of materials.
Young’s Modulus:
Young’s modulus is defined as the ratio of stress to strain. It is a measure of the stiffness of an elastic material. As mentioned in Fig. 1, it is the slope of the line in the straight part of the stress-strain curve.
Importance of Stress-Strain Curve
The stress-strain curve of material provides engineers with a long list of mechanical properties needed for engineering design. The capacity of a material to withstand loads prior to fracture is obtained from the stress-strain curve. The allowable material stress values are normally decided from the yield strength value for ductile materials and from the tensile strength value for brittle materials. The curve also provides a rough estimate of its deformation under loading conditions.
The stress-strain curve also helps in fabrication processes like extrusion, bending, rolling, etc. From the curve, the amount of force required for plastic deformation can be calculated.
Stress-Strain Curve of Aluminum
The stress-strain curve of the most widely used ductile material Steel is shown in Fig. 1 above. Fig. 2 below shows the typical stress-strain curve for Aluminum. For Aluminum the yield strength is not distinct; So the yield strength is decided using the proof stress method.
Stress-Strain Curve for Cast Iron
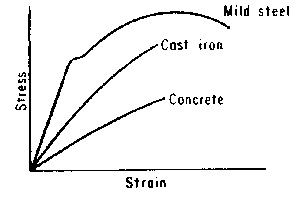
Cast Iron is a brittle material. For brittle materials, yield strength is not present as these materials fail all of a sudden. So, tensile strength is the main important parameter for brittle materials like Cast Iron, glass, and Concrete. Fig. 3 below provides a typical stress-strain curve for cast iron and concrete.
Stress-Strain Curve for Elastomers
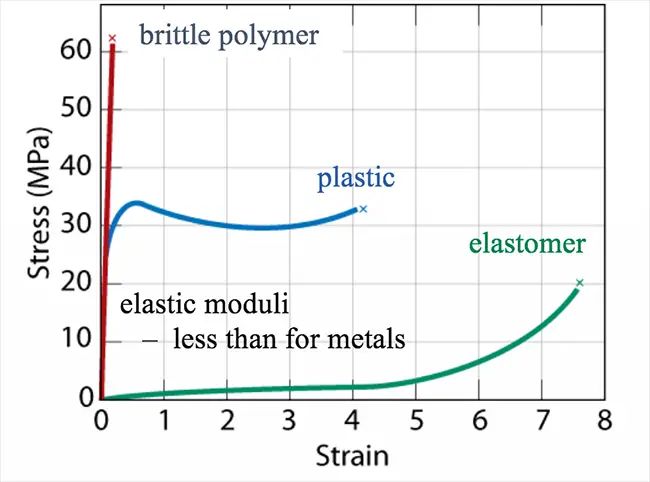
Elastomers normally exhibit permanent plasticity. So, the stress-strain curve of elastomers is quite different from ductile and brittle materials. Fig. 4 below shows a typical example of the stress-strain curve of elastomers, plastic material, and brittle polymers.
Stress-Strain Curve for Perfectly Plastic Materials
Perfectly plastic or ideal plastic material will not show any work-hardening during plastic deformation. Fig. 5 shows the stress-strain curve for perfectly plastic, linear elastic, viscoelastic, and elastoplastic materials.
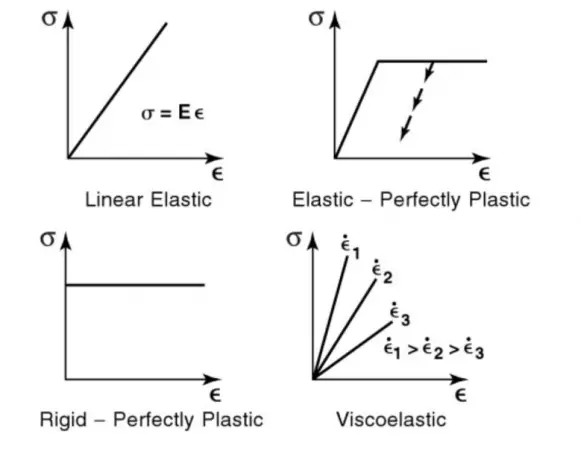
Please note that
- the stress-strain curves in tension and compression for all materials are different. The stress-strain behavior (curve shape) may be similar but stress values differ considerably.
- the stress-strain curve at room temperature is different from the same curve at other temperatures. Fig. 6 shows a typical example of a stress-strain curve for stainless steel and fiber-reinforced composite materials.
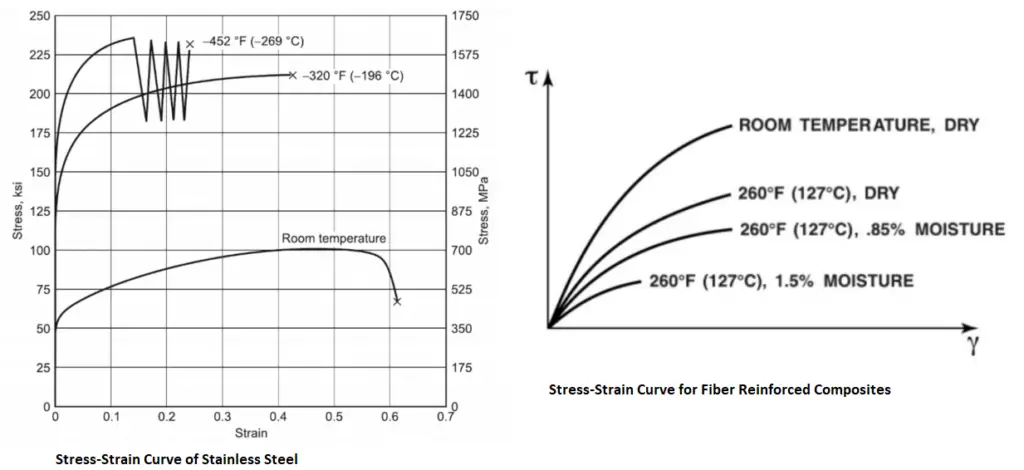
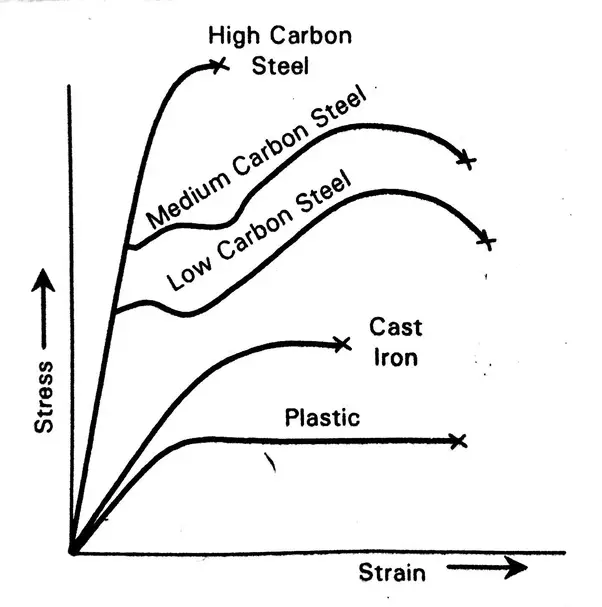
Fig. 7 below shows a comparative image showing stress-strain curves of various materials.

Very nice explanation, Anup.
Good work.
Very good….Dada….. it’s really helpful for me