This not-so-brief write-up is basically a summary of my notes on this subject when several years back I decided to study this interesting subject in somewhat detail. For interested readers, this is only a microcosm and references cited in this write-up should be referred to for details. The references cited forms the basis of this write-up, including the figures used. The issue of compressive stress has not been discussed in this write-up. I am hopeful that this write-up will give useful pointers to a reader interested in delving into this subject in greater detail.
1.0 Basics of Creep
Creep is time dependent deformation at constant stress. A schematic arrangement for creep testing is shown in Figure 1.

Usually, three stages are observed in creep tests; the primary stage where the strain rate increases initially before it reduces and takes a steady value (secondary creep), and towards the end of secondary creep there is an unstable increase in strain rate leading to rupture.
The curve shown in Figure is an idealized curve, and for some materials, secondary creep may not occur. Steady-state creep rate is one of the important outputs of a creep test result. Stress-strain curves for various constant values of time called isochronous curves are often needed in design. They are constructed from strain versus time data for various stress levels. Figure 3 and Figure 4 show the construction of an isochronous curve. Strains corresponding to a time say 𝑡1 is obtained as in Figure 3, and they are then plotted against various stress values as in Figure 4, forming the isochronous stress-strain curve for time t1. Similar curves can be constructed for other values of times 𝑡2 and 𝑡3 so that a family of stress-strain curves is formed.


2.0 Time-temperature parameters in Creep analysis
Development of cracks, crazing (network of fine cracks) as well as other mechanisms contribute to leading creep deformation to the point of rupture. A big challenge lies in extrapolation of test data. A piping or pressure vessel component may have a design life of 20 years or ore but the test data is usually available for 10,000 hours. If extrapolation is done, abrupt changes in slope may occur due to shift in the creep mechanisms. A more successful approach is to use data from relatively short time tests, but at temperatures above the service temperature of interest, to estimate the 3behavior for the longer time at the service temperature. Under these circumstances, a common physical mechanism for tests and service is more likely than for extrapolation at constant temperature. Such approaches involve use of time-temperature parameters. I will briefly discuss two approaches, the Sherby-Dorn Parameter and Larson-Miller parameter.
2.1 Sherby-Dorn parameter
Arrhenius rate equation is the basis of the Sherby-Dorn parameter. A key assumption is that the activation energy for creep is constant.
Arrhenius equation is
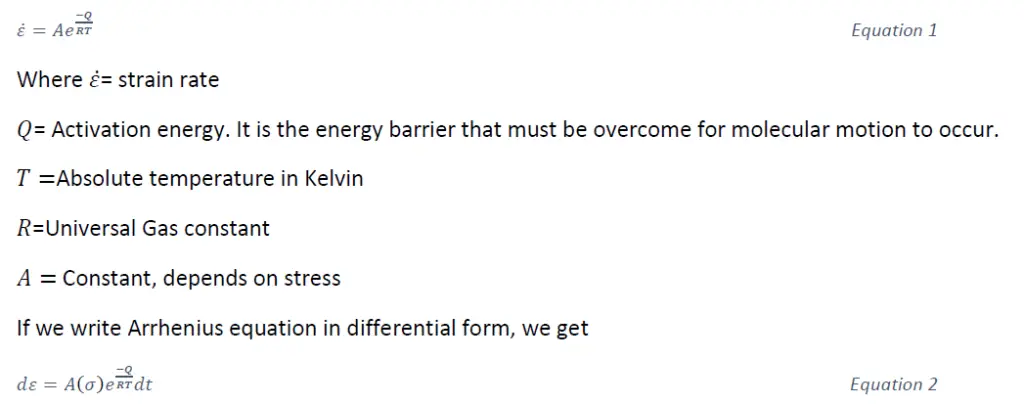
If we integrate the equation and discard the constant of integration so that only the steady state creep strain occurs, we get

Where 𝜃=temperature-compensated time.
In Ref [1] it has been shown that the Creep strain at rupture is fairly constant for a given value of temperature-compensated time 𝜃𝑟 to rupture for various Aluminium alloys. Hence 𝜃𝑟 depends only on stress, so for a material there should be a single curve relating 𝜃𝑟 and stress for various combinations of temperature 𝑇 and rupture time 𝑡𝑟. Sheldon-Derby parameter is defined as 𝑃𝑆𝐷=log 𝜃𝑟.
Taking logarithm to base 10 on both sides of Equation 4, we get
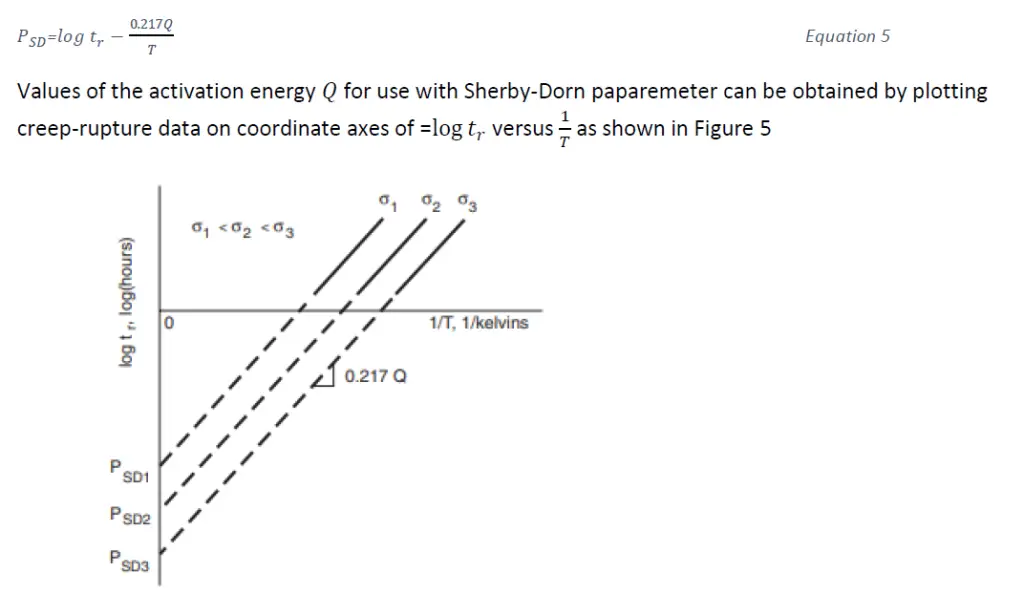
A family of parallel straight lines is expected, one for each value of stress. These lines have slopes given by 0.217𝑄 and each intercept at 1/𝑇=0 can be interpreted as the 𝑃𝑆𝐷 value for that stress. Once 𝑄 is known, stress-life data can be employed to make a plot of 𝑃𝑆𝐷 versus stress.The data for all stresses and temperatures should fall together along a single curve, with the correlation of the data being a measure the success of the parameter for any particular set of data. Using such a plot and equation [5], we can determine rupture times 𝑡𝑟 for particular values of stress and temperature. The test data used to obtain 𝑃𝑆𝐷 versus 𝜎 plot generally involve shorter rupture times than the service lives of interest. Hence, the test data at relatively short 𝑡𝑟 and high temperature can be used to predict the behavior at longer 𝑡𝑟 and lower temperature.

2.2 Larson-Miller parameter
Larson-Miller parameter is an analogous approach to Sherby-Dorn but uses different assumptions. The Larson-Miller parameter can also be derived from Equation [4] substituting θ=𝜃𝑟 and t=𝑡𝑟 and taking logarithm to base 10 of of sides. However, Q is assumed to vary and 𝜃𝑟 to be constant. The Larson Miller parameter is defined as 𝑃𝐿𝑀=0.217𝑄 and a constant 𝐶=−log 𝜃𝑟 is used. On this basis we get
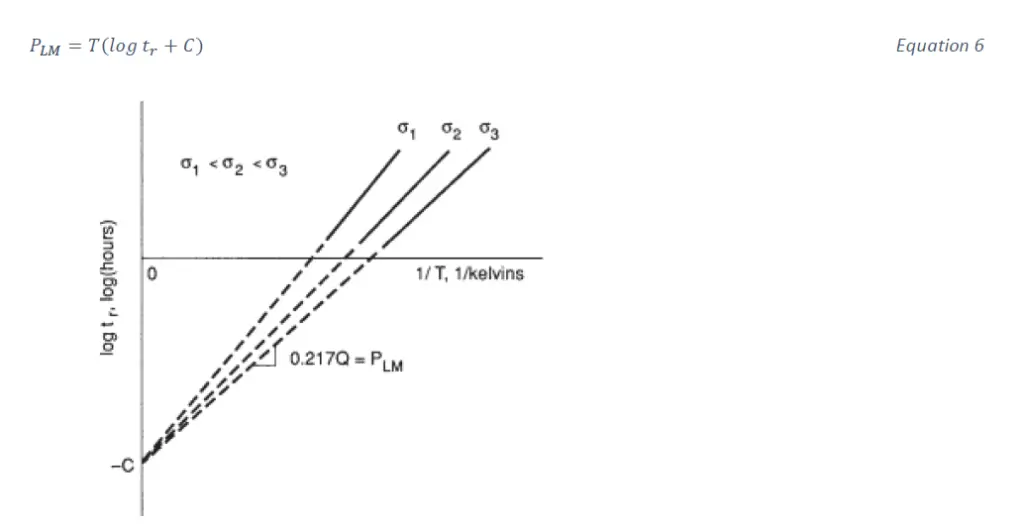
The value of 𝐶 can be interpreted as an extrapolated intercept on the plot of log 𝑡𝑟 versus 1/𝑇 as shown in Figure 1

3.0 ASME codes and Creep
3.1 Allowable stress
For Section 1 and Section VIII -1 applications, allowable stress criteria are given in Appendix 1 of Part D. The allowable stress at elevated temperature is the lesser of:
- a) the allowable stress given by the criteria based on yield and ultimate strength
- b) 67% of average stress to cause rupture at 100,000 hours
- c) 80% of the minimum stress to cause rupture in 100,000 hours and
- d) 100% of the stress to cause a minimum creep rate if 0.01%/1000 hrs.
About 1500F, however, the factor on average stress to rupture is adjusted to provide the same time margin on stress to rupture as existed at 1500F. Although the allowable stress is a function of the creep rupture strength at 100,000 hours, this is not intended to imply that there is a specified design life for these applications. There are additional criteria for welded pipe and tube that are 85% of the above values.
Unlike previous editions, the 2007 edition of Section VIII D2 covers temperatures in the creep regime. The time-dependent allowable stress criteria for VIII-2 are the same for VIII-1. However, because the time independent criteria are less conservative, tensile strength divided by a factor of 2.4 or 3.5 , the temperature at which the allowable stress is governed by time-dependent properties is lower in VIII-2 than VIII-1.
The allowable stress criteria for components of Class 1 nuclear systems covered by Subsection NH of Section III, of the ASME B&PV code are different than for non-nuclear components. For these nuclear components, the allowable stress at operating conditions for a particular material is a function of the load duration and is the lesser of :
- a) the allowable stress for Class 1 nuclear systems based on yield and ultimate strength
- b) 67% of the minimum stress to rupture in time, T
- c) 80% of the minimum stress to cause initiation of third stage creep in time, T and
- d) 100% of the average stress to cause a total ( elastic-plastic and creep) strain of 1% in time, T.
- These allowable stress criteria are more conservative than for non-nuclear systems for the same 100,000-hour reference time.
However, these allowable stresses apply to operating loads and temperatures, generally not defined as conservatively as the design conditions to which the allowable stresses apply for non-nuclear applications. There are also additional criteria for allowable stresses at welds and their heat-affected zone [2].
The allowable stresses for class 2 and 3 elevated temperature nuclear systems are in general similar to those for non-nuclear systems. Subsection NB covers class 1 nuclear components in the temperature range where creep effects do not need to be considered.
3.2 Members in bending
Generally, two equations are used for stress and strain in the creep regime: Norton’s equation and the elastic analog method [2].
Norton’s equation relates strain rate to stress [2]

Norton’s equation is difficult to implement for most real-life problems. The complexity arises from the non-linear relationship between stress and strain rate. In addition, the equation has to be integrated to obtain stress and deflections.
The elastic analog method is [2]

The assumptions for bending of beams in the creep regime are based on assumptions that are similar to those for beams in elastic analysis, as:
- a. The length of the beam is much larger than the cross-section.
- b. Plane cross sections remain plane after bending.
- c. Bending deflections are small in comparison to the length of the beam.
- d. Stress-strain diagrams are the same for both the tensile and well as compressive sides of the beam.
- e. The plane of bending is the plane of symmetry.
Strain at a given point in a beam due to bending is

Where 𝑧=location of a point measured from the neutral axis
𝜌= radius of curvature
The beam is assumed to have achieved a stationary stress condition. Then, using equations 8 and 9, we get [2]

3.3 Load and displacement controlled limits for components operating in the Creep regime
The below diagram [2] shows the limits set out in ASME SEC III NH for Creep range for Load and displacement-controlled limits
![Flow Diagram for Elevated temperature analysis NH-3221-1[2] [3]](https://whatispiping.com/wp-content/uploads/2024/11/image-52.png)
A noticeable change in Subsection NH with respect to ASME SEC VIII D2 Part 5 is in the second row of Figure 9. The 1.5𝑆 limit does not apply when loading conditions are of sufficient durations in the creep regime for creep effects to redistribute elastically calculated stress and strain. This is reflected by the 𝐾𝑡 factor in the stress evaluation in ASME SEC III-NH.
The procedure for strain and deformation limits is intended to prevent ratcheting. Section III-NH gives the designer the option to using three methods for analysis they are elastic, simplified-inelastic and inelastic analysis. The object of all these methods is to limit the strains in the operating condition to 1% for membrane, 2% for bending and 5% for local stress. At welds, the allowable strain is one half those values. A point to note: a 1% strain in a flange may result in an unwanted leakage, whereas the same strain at the junction of a flat head to shell junction may be acceptable.
The elastic method, which is very conservative, is generally applicable when the primary plus secondary stresses are below the yield strength. The simplified inelastic analysis, which has less conservative built into it compared to the elastic analysis, is based on rounding the accumulated membrane strain. The last option is to perform an inelastic analysis. The inelastic analysis yields accurate results but has the drawback of being expensive and time consuming to perform. It requires a large amount of material property data that may not be available for material under consideration.
One potential disadvantage of using the strain and deformation controlled limits of III-NH is that it requires separate treatment of primary and secondary stress categories. This condition is validated in Sec VIII D2 by combining the primary and secondary stress categories into one quantity. For simple structures, the separation of primary and secondary stresses in III-NH may not be a big problem. But for most complex structures with asymmetrical geometry and loading, it can be difficult, if not impossible, to sort out primary and secondary stress categories from a detailed finite element analysis. Section III-NH however does give the designer the option, called test A-3, to use the combination of primary plus secondary stress limits similar to VIII-D2, when the effects of creep are negligible. This creep modified shakedown limit avoids the potential problem of separating primary and secondary stresses [2].
3.3.1 Elastic analysis
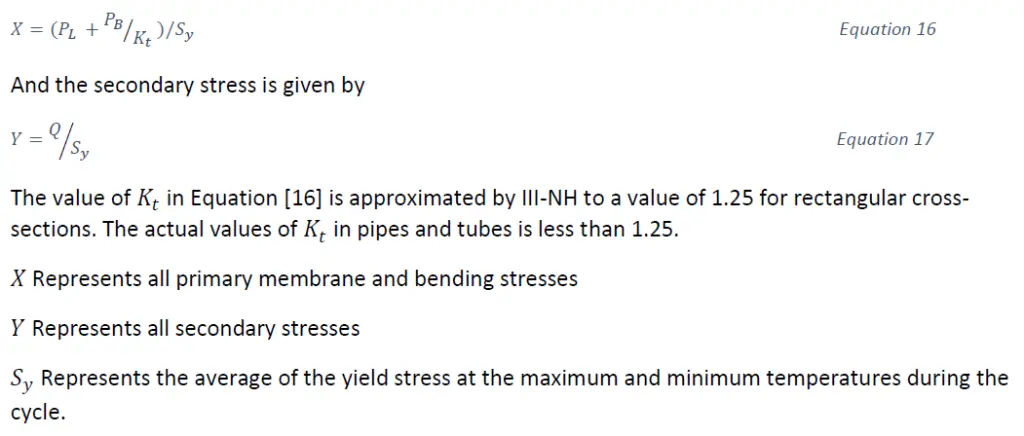
The strain and deformation limits in the elastic stress analysis are considered to be satisfied if they meet the requirements of A-1, A-2 or A-3. The membrane and bending stresses used in these tests are defined as [2]
Test A-1
This test applies for cycles where both extremes of the cycle are within the creep range of the material. The governing equation is

Where 𝑆𝑎 is the lesser of
- a. 1.25𝑆𝑡 using the highest wall averaged temperature during the cycle and time value of 104 hours.
- b. The average of the two 𝑆𝑦 values associated with the maximum and minimum wall averaged temperature during the cycle.
The requirement of item (a) is based in the concern that creep relaxation at both ends of the temperature cycle will increase the potential for ratcheting. Experience [2] has shown that using a value of 𝑆𝑡 at 104 hours as a stress criterion us a realtistic assumption. The requirement of (b) is based in on averaging the yield stress associated with the maximum and minimum temperatures as a good approximation.
Test A-2
This test is applicable for those cycles in which the average wall temperature at one of the stress extremes defining the secondary stress range, 𝑄, ks below the temperature shown in Figure 10

The values shown in Figure 10 are the approximate temperatures above which the material allowable stress values at 100,000 hours are controlled by creep and rupture.
![Temperature limits [2]](https://whatispiping.com/wp-content/uploads/2024/11/image-58.png)
Test A-3
This test, although applicable to all conditions, was originally intended for components that are in the creep range for only a portion of their expected design life. Compliance with this test indicate that creep is an issue is not an issue and the rules of VIII-D2 be used directly. The calculated stresses are satisfied when all of the following criteria are met:
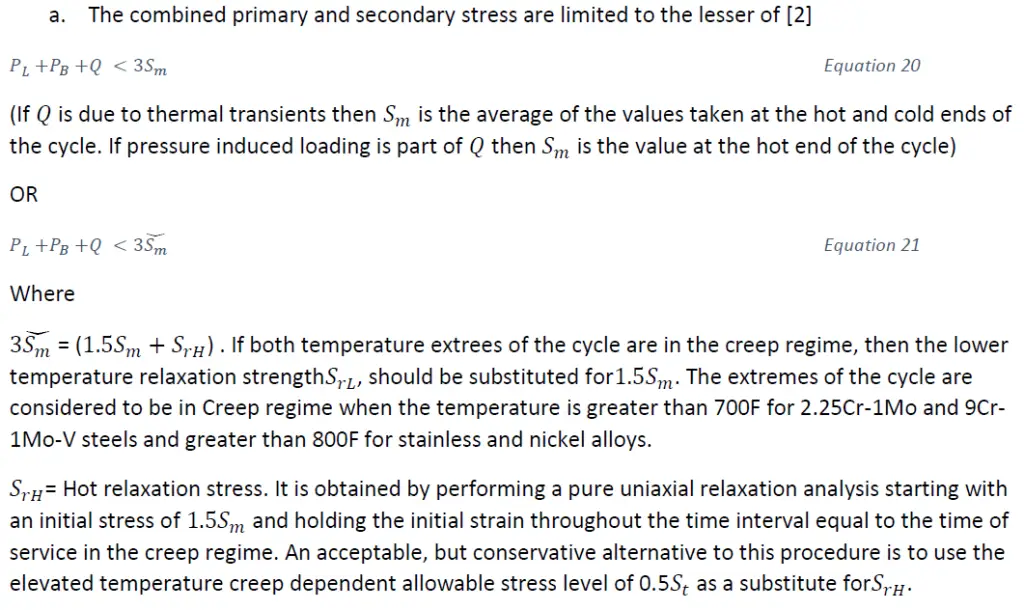
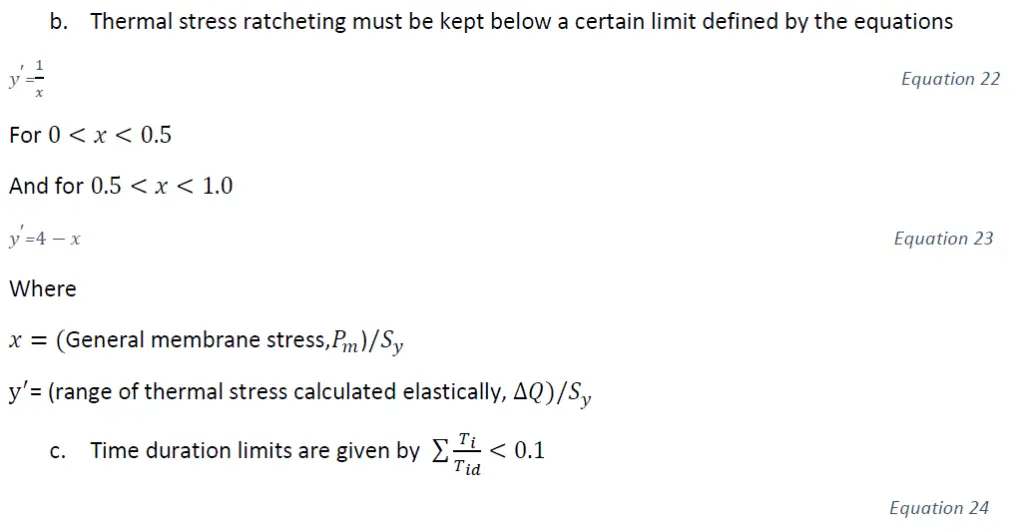
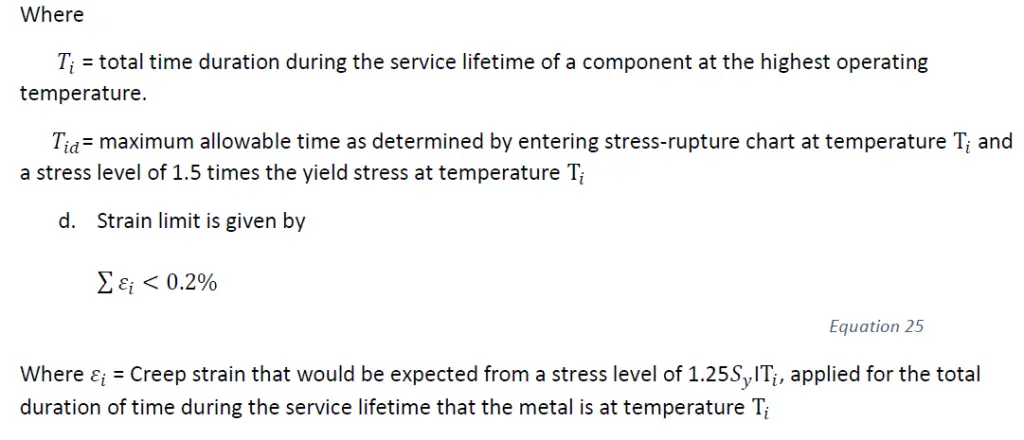
![Strain controlled limits-Elastic analysis [2]](https://whatispiping.com/wp-content/uploads/2024/11/image-66.png)
3.3.2 Simplified inelastic analysis (Bree Diagram)[2]
The simplified inelastic analysis is based on the concept of requiring membrane stress in the core of a cross-section to remain elastic, whereas bending is allowed to extend in the plastic region. This concept is based on the Bree diagram. The Bree diagram assumes secondary stress to be mainly generated by thermal gradients. Figure [12] from Reference [2] is plotted with primary stress as the abscissa and the secondary stress as the ordinate. The diagram is divided into various zones that define specific stress behavior of the shell. It assumes an axisymmetric thin shell with an axisymmetrc loading. It also assumes the thermal stress to be linear across the thickness. For a detailed derivation and assumptions relating to Bree diagram Appendix A of Reference [2] can be referred to.
The various limitations and zones of the diagram are as follows
![Bree Diagram [2]](https://whatispiping.com/wp-content/uploads/2024/11/image-68.png)
Limitations [2]
- It is assumed that the material has an elastic perfectly-plastic stress-strain diagram.
- Because mechanical stress is considered primary stress, it cannot exceed the yield stress value of the material. Thermal stress, on the other hand is considered secondary and this exceed the yield stress of the material.
- Initial evaluation of the mechanical and thermal stresses in the elastic and plastic regions was made without any consideration to relaxation or creep.
- Final results were subsequently evaluated for relaxation and creep effect.
- It is assumed that stress due to pressure is held constant, while the thermal stress is cycled. Hence, pressure and temperature stress exist at the beginning of the first half of the cycle and only pressure exists at the end of the second half of the cycle.
Zone E
- Stress is elastic below the creep range
- Ratcheting does not occur below the creep range.
- Stress redistributes to elastic values above the creep range.
Zone S1
- Below the creep range, the stress is plastic on the outside surface of the shell during the first half cycle. The stress shakes down to elastic in all subsequent cycles.
- Ratcheting does not occur below the creep range.
- Ratcheting occurs in the creep range.
- Shakedown is not possible in the creep range.
Zone S2
- This zone is a subset of zone S1.
- Below the creep range, stress is plastic on both surfaces of the shell during the first half of first cycle. Stress shakes down to elastic in all subsequent cycles.
- Ratcheting does not occur below the creep range.
- Ratcheting occurs in the creep range.
- Shakedown is not possible at the creep range.
Zone P
- In this zone, alternate plasticity occurs in each cycle below the creep range.
- Shakedown is not possible below as well as in the creep range.
- Failure occurs due to low cycle fatigue below the creep range.
- Shakedown is not possible at the creep range.
Zone R1 and Zone R2
- Ratcheting occurs below and in the creep range.
- Shakedown is not possible below as well as in the creep range.
Actual diagram from ASME III-NH is shown in Figure 13 . Z lines of constant elastic core stress values. The key feature of the technique is identifying an elastic core in a component subject to primary loads and cyclic secondary loads. Once the magnitude of this elastic core has been established, the deformation of the component can be bounded by noting that the elastic core stress governs the net deformation of the section. Deformation in the ratcheting, R, regions of the Bree diagram can be estimated by considering individual cyclic deformation. The ASME simplified inelastic analysis procedure for strain limits consists of satisfying test B-1, test B-2 or test B-3.
![Effective Creep stress parameter Z for simplified inelastic analysis using test numbers B-1 and B-3(ASME-III NH) [2]](https://whatispiping.com/wp-content/uploads/2024/11/image-69.png)
For the tests B-1, B-2 and B-3,
- X includes all membranes, primary bending and secondary bending stresses due to pressure induced as well as thermal induced membrane stresses.
- Y includes all thermal secondary stresses
- 𝑆𝑦𝐿 Is the yield stress at the cold end of the cycle.
The following conditions must be met to satisfy B-1 and B-2 tests [2]
- The average wall temperature at one of the stress extremes defining each secondary equivalent stress range 𝑄, is below the applicable temperatures in Figure 10.
- The individual cycle cannot be split into sub-cycles.
- Pressure –induced membrane and bending stresses and thermal induced membrane stresses are classified as primary stresses for purposes of this evaluation.
- Definitions of X and Y in Equation 19 and 20 apply for these two tests except that the value of 𝑆𝑦 as defined in these two equations is replaced with 𝑆𝑦𝐿 the yield stress at the lower end of the cycle.
- These tests are applicable only in regimes E, 𝑆1, 𝑆2 and P in Figure 13
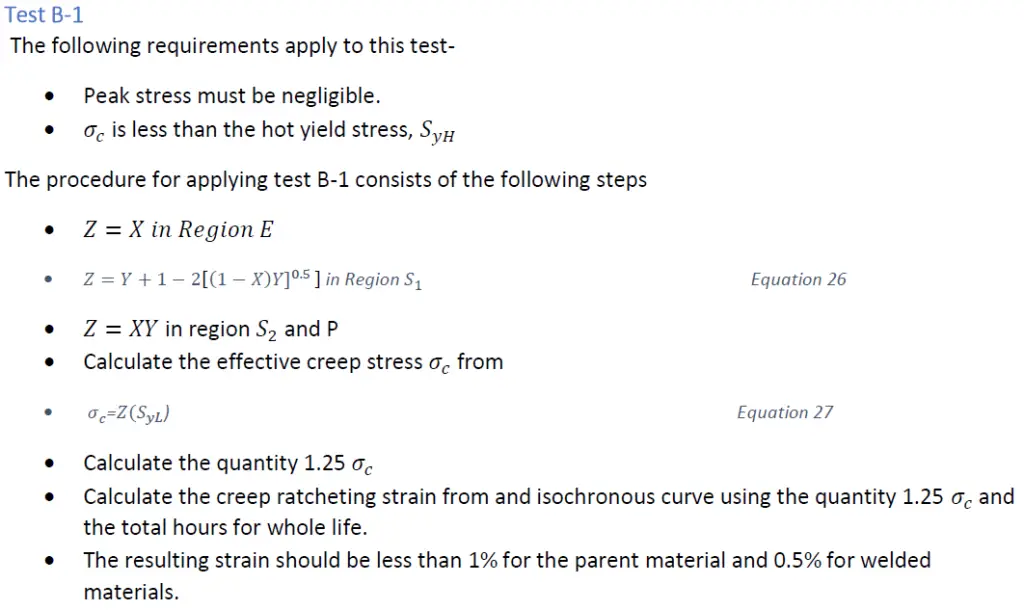
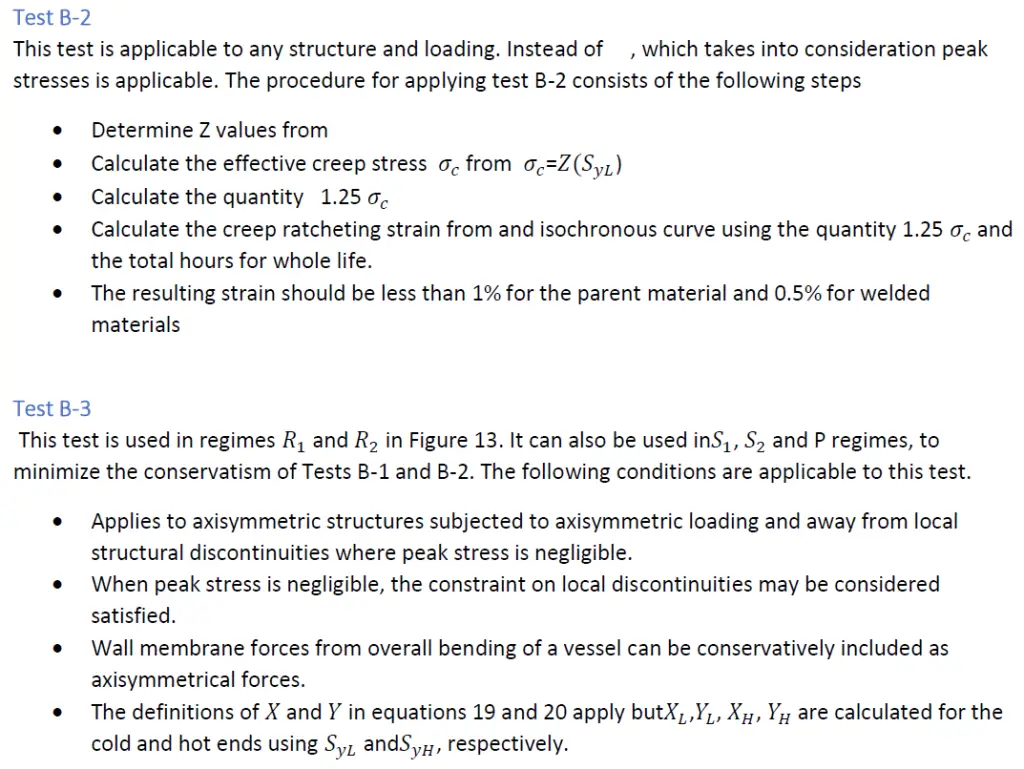
The procedure for this test consists of calculating the inelastic strains,𝜀, in accordance with the equation [2]
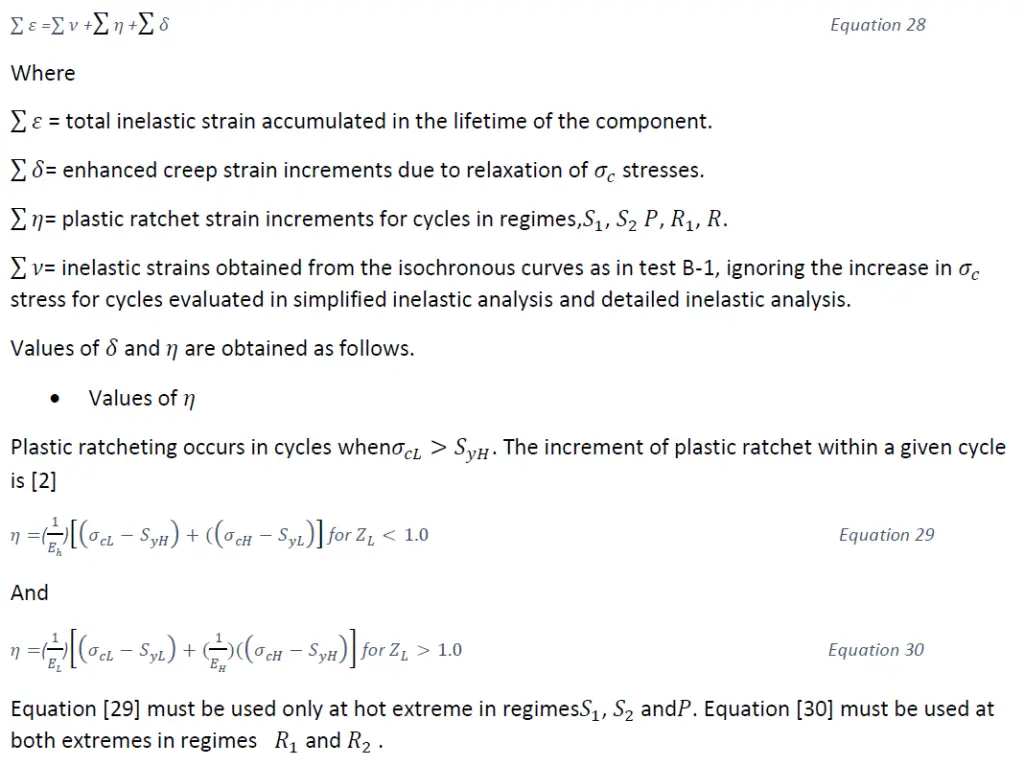

3.4 Creep –Fatigue interaction
In the creep range, cyclic life becomes more difficult. Stress relaxation at a given point affects the cyclic life of a component. The level of triaxiality and stress concentration factors play a significant role on creep-fatigue life at elevated temperatures and Poisson’s ratio needs to be adjusted for inelastic stress levels. In addition, fatigue strength tends to decrease with an increase in temperature due to surface oxidation or chemical attack. These and other factors contribute to the complexity of creep-fatigue interaction [2].
The rules for creep- fatigue interaction stated herein are applicable when [2]
- The rules for tests A-1 through A-3 are met and/or the rules for tests B-1 and B-2 are met with 𝑍<1.0 are met. However, the contribution of stress due to radial thermal gradients to the secondary stress range may be excluded for this assessment of the applicability of elastic creep-fatigue rules, A-1 and A-2.
- The ( 𝑃𝐿 +𝑃𝐵+𝑄)≤3𝑆𝑚; rule is met using 3𝑆𝑚; lesser of 3𝑆𝑚 and 3𝑆𝑚̌ (defined for A-3).
- Pressure-induced membrane and bending stresses and thermal induced membrane stresses are classified as primary (i.e. load controlled) stresses.
The analysis procedure can be summarized as
- Step 1 Determination of the total number of hours,𝑇𝐻, expended at temperatures in the creep range.
- Step 2 Determination of the hold temperature, Τ𝐻𝑇 , to be equal to local metal temperature that occus during sustained normal operation.
- Step 3 Unless specified otherwise, for each cycle type j, we have to define the average cycle time as
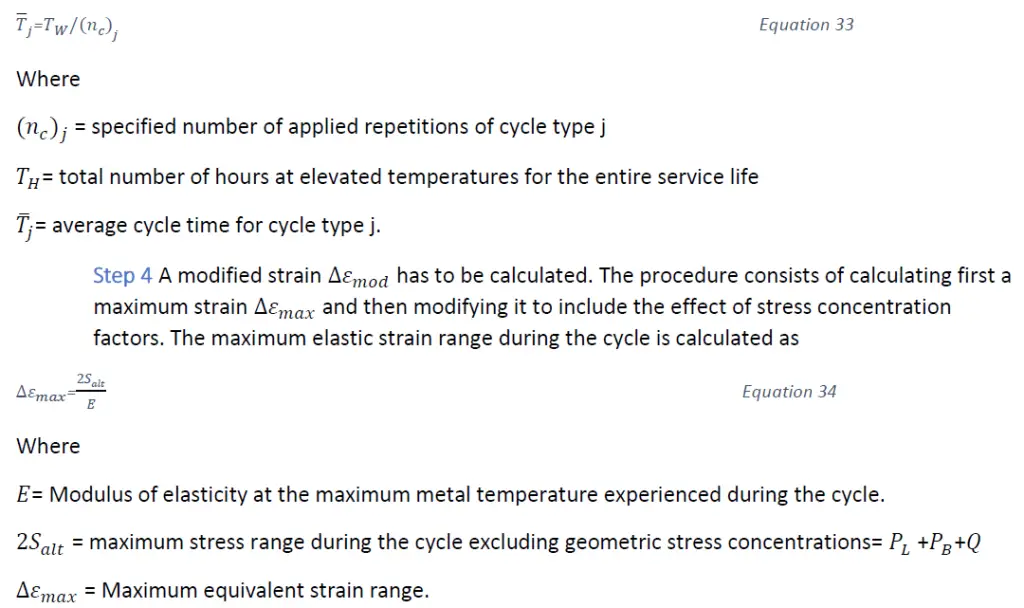
The maximum elastic strain range is then used to calculate a modified strain Δ𝜀𝑚𝑜𝑑 that includes the effect of local plasticity and creep, which can significantly increase the strain range at stress concentrations. Subsection NH gives the designer the option of calculating this quantity by any one of three different methods. These methods, of varying complexity and conservatism, are based on modifications of the Neuber equation. Neuber’s basic equation is of the form
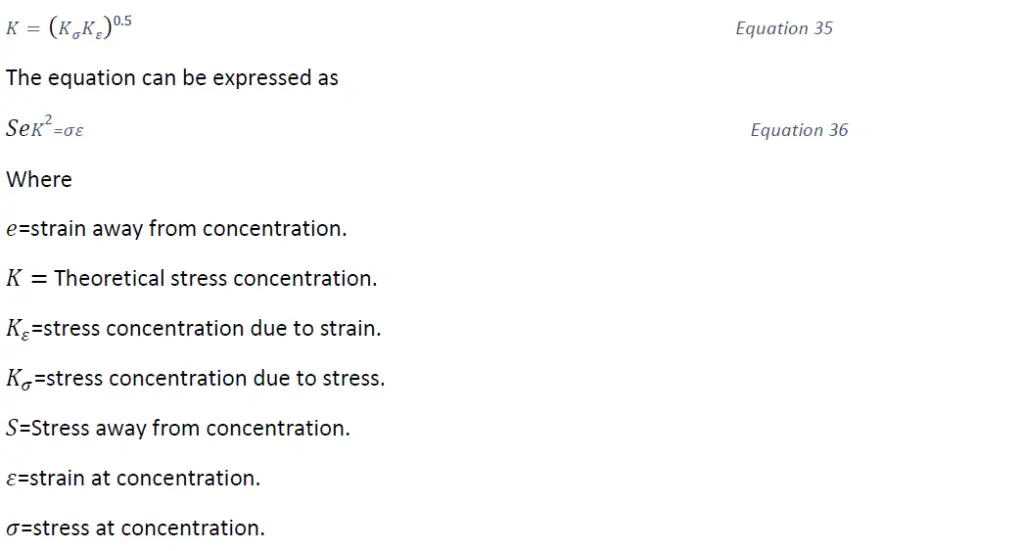
Equation 35 indicates that the total stress concentration at a point in the plastic or creep region is equal to the square root of the products 𝐾𝜀 and𝐾𝜎. The value of 𝐾𝜎 decreases m whereas the value of 𝐾𝜀 increases with an increase in yield and creep levels. Equation 36, which is an alternate form of equation 35, shows that the total stress concentration is a function of the product of the actual strain and actual actual stress at a given point.
All three methods [2] of calculating modified strain Δ𝜀𝑚𝑜𝑑 use a composite stress-strain curve as shown in Figure 14 . The composite stress-strain curve is constructed by adding the elastic stress-strain curve for the stress range 𝑆𝑟𝐻 to the appropriate time dependent i.e. hot tensile isochronous stress-strain curve for the material at a given temperature. The value of 𝑆𝑟𝐻 can be conservatively assumed as equal to0.5𝑆𝑡.
![Stress-strain relationship [2] [3]](https://whatispiping.com/wp-content/uploads/2024/11/image-76.png)
First method [2]
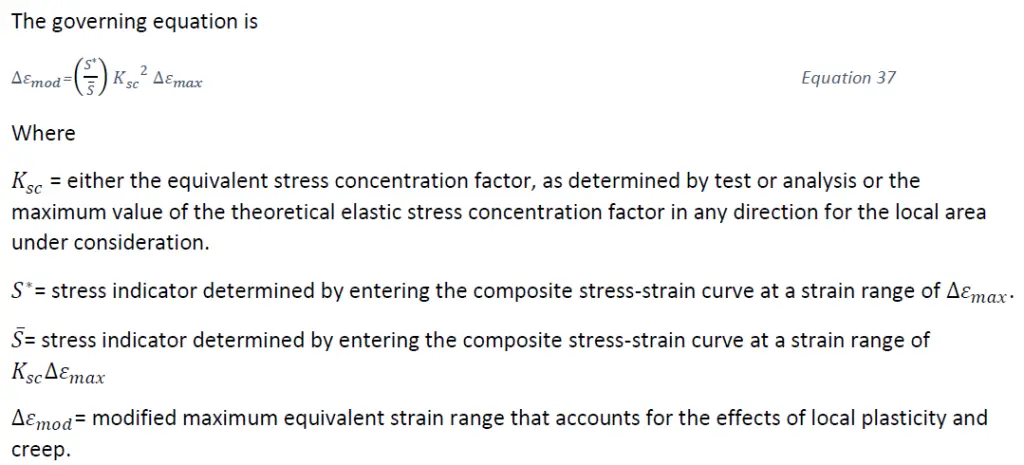
The equivalent stress concentration factor is defined as the effective i.e. Von Mises primary plus secondary plus peak stress divided by the effective primary plus secondary stress. Fatigue strength reduction factors developed from low-temperature continuous cycling tests may not be acceptable for defining 𝐾𝑠𝑐 when creep effects are not negligible.
Second method [2]

Third method
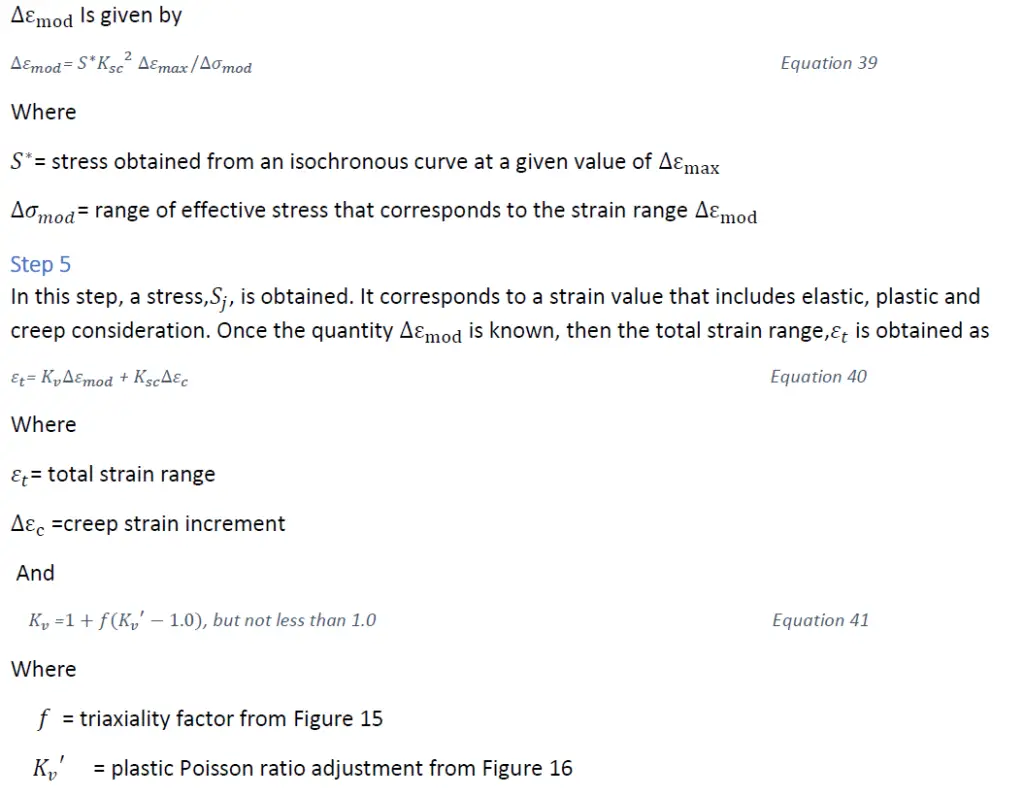
![Inelastic multi-axial adjustment [2] [3]](https://whatispiping.com/wp-content/uploads/2024/11/image-80.png)
![Adjustment for inelastic biaxial Poisson ratio [2] [3]](https://whatispiping.com/wp-content/uploads/2024/11/image-81.png)
The Creep strain increment Δεc , is obtained from an isochronous stress-strain curve. The stress value for entering in the curve is obtained from 1.25𝜎𝑐 where 𝜎𝑐 is obtained from Equation 27. The time to be used in the isochronous stress-strain curve for determining 𝜀𝑐 is obtained by one pf two methods as:
- Method 1- the time based on one cycle
- Method 2- the time based on the total number of hours during the life of the component and the resultant strain is then divided by the number of cycles.
Method 1 is generally applicable to components with a small number of cycles and high membrane stress such as hydrotreaters. Method 2 is generally applicable to components with repetitive cycles and small membrane stress as headers in heat recovery steam generators [2].
Finally, the value of 𝑆𝑗 is obtained from an appropriate isochronous chart using Equation 40 for strain and the time –independent curve in the chart. 𝑆𝑗 Is defined as the initial stress level for a given cycle.
Step 6
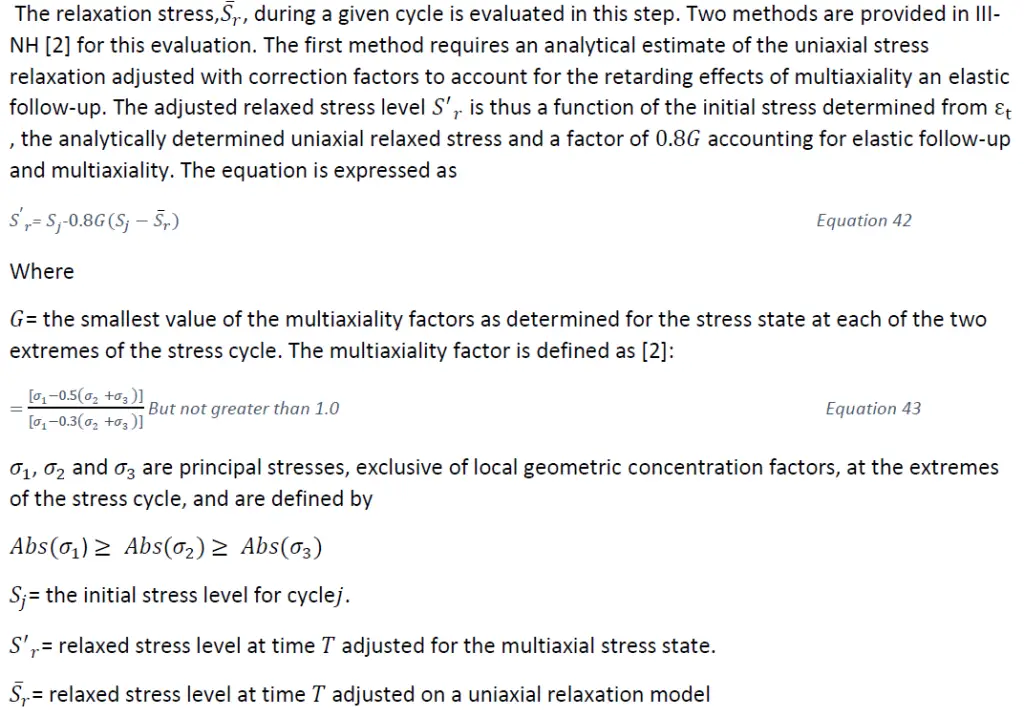
The second method for determining stress relaxation is based on the isochronous stress-strain curves. Starting at the stress level determined from 𝜀𝑡, the time to relax to lower stress levels is determined my moving vertically down at a constant strain until intercepting the curve for the time of interest as shown in Figure 17. Because of the conservatism inherent in this approach, multiaxial and elastic follow-up corrections are not required.
![A method of determining relaxation (ASME III-NH) [2] [3]](https://whatispiping.com/wp-content/uploads/2024/11/image-83.png)
The stress in either the adjusted analytical relaxation or that obtained from the isochronous curves is not allowed to relax below a factor of 1.25 times the elastic core stress,𝜎𝑐, as determined by the procedures for evaluation of the strain limits using simplified inelastic analysis. This lower stress value is, 𝑆𝐿𝐵 is shown in Figure 18
![Stress -relaxation limits for creep damage (ASME III-NH) [2] [3]](https://whatispiping.com/wp-content/uploads/2024/11/image-84.png)
Step 7
The governing equation for creep-fatigue is given by

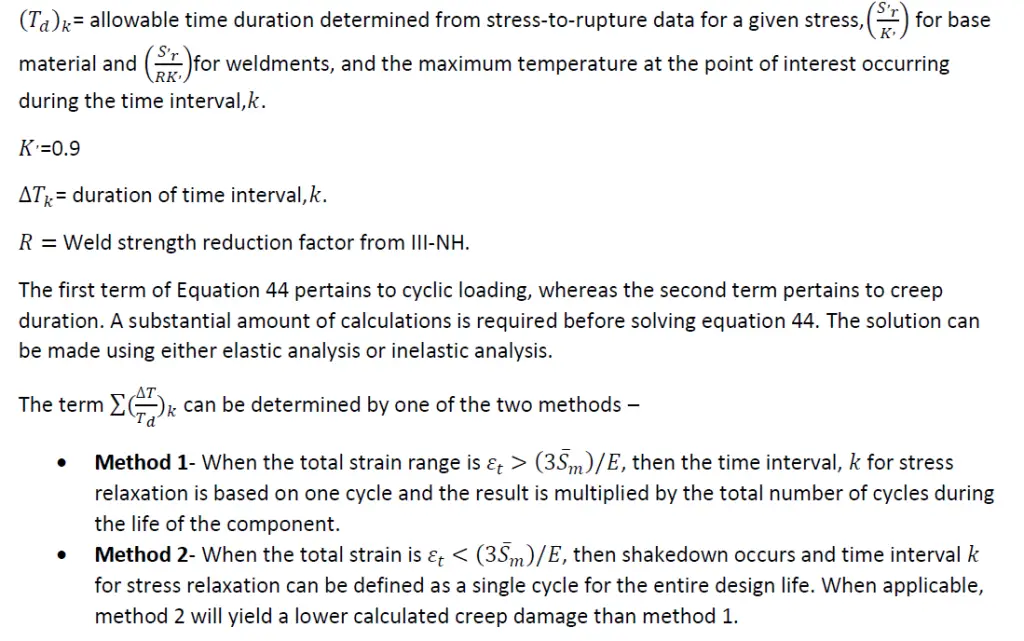
![Creep-fatigue damage envelop (ASME III-NH) [2] [3]](https://whatispiping.com/wp-content/uploads/2024/11/image-87.png)
3.5 Reference stress method
When it’s difficult to segregate stresses into “Primary” (Load driven) and “Secondary” (displacement driven), reference stress method, which is based on limit state analysis, can be used.
The initial idea of the reference stress was that the creep behavior of a structure could be evaluated by use of the data from a single creep test at its reference stress [2]. Initially applied to problems of creep deformation, there were number of analytical solutions developed for specific geometries. As shown in Ref [2], [4], as Reference stress is independent of creep exponent and that the solution of infinite creep exponent is analogous to the limit solution corresponding to ideal plasticity, reference stress could be conservatively obtained from [2]

There had been good correlation between experimental and rigorous analytical approaches and reference stress approach [2]. Although reference stress has not been incorporated in ASME B&PV code, it has been used in the British elevated temperature design code for piping systems 𝑅5 and in European code EN13445.However, the British standard recommends an adjusted reference stress for design given by a factor of 1.2 times the reference stress shown in Equation 16. EN13445 cautions against the use of reference stress method by those not familiar with its application. Part of the reason for this concern is inherent in the basis of both limit loads and reference stress determination. Both are based on structural stability considerations and not local damage. As such there is inherent requirement that the material under consideration be sufficiently ductile. This is easier to achieve at temperatures below the creep range. Within the creep range, ductility decreases. Particularly at lower stress levels associated with design conditions. Ref [2] states “there had been some studies to more specifically identify creep ductility requirements, but current thinking would be to put it in the range of 5% to 10%for balanced structures without extreme strain concentrating mechanisms”. Ref [2] also states “considerable caution should be taken in applying reference stress methods to highly unbalanced systems, particularly if the creep ductility of the material of construction is suspect”.
3.6 Stationary Creep-Elastic analog [2]
Subject to certain restrictions and representations of creep behavior, a structure subjected to a constant load will reach a condition where the stress distribution does not change with time, thus the term “stationary creep”. The fundamental restriction on material representation is that the creep strain is the product of independent functions of stress and time. Conceptually, stationary creep is valid when the strains and strain rates due to creep are large compared to elastic strains and strain rates.
If the structure is statically determinate throughout, then the initial stress distribution will not change with time, subject to the applicability of small displacement theory that applies to the large majority of practical design problems. Examples would be a single bar with a constant tension load and the stresses in the wall of a thin-walled cylinder, remote from discontinuities, subject to constant internal pressure.
However, it is with indeterminate structures that stationary creep concept is of most value. In a structure with redundant load paths or subject to local redistributions, i.e. a beam in bending, stress redistribution takes place relatively quickly; on the order of the time it takes for the creep strain to equal twice the initial elastic strain. Reference [2] states “for a set of variables representative of pressure vessel in current use, Penny and Marriott calculated an effective redistribution tie of about 100 hours. Although this would be a long time if the vessel were subjected to significant daily cycles, it is a short time compared to times of extended operation.”
A number of investigators have shown that because the stress distribution in stationary creep does not vary with time and thus corresponding creep rates are constant, the stationary creep stress distribution is analogous to non-linear elastic stress distribution problem [2]. This is usually referred to as “elastic analog”. Although the elastic analog has been shown as valid in more general terms, a more convenient representation is based on the analogy between a simple power law representation of steady, secondary creep in which primary creep is considered negligible. This is quantified in Equation [8].
Figure [10] from Reference [2] shows stationary creep solutions for various values of the power law exponent “𝑛”. This is the non-dimensional stationary creep solution for a beam in bending with a constant applied moment. For n=1 the stress distribution is elastic and for n -> ∞ the distribution corresponds to that of the assumption of ideal plasticity. All the distributions pass through a point partway through the wall referred to as a “skeletal point”. The reduction in steady-state creep stress as compared to the initial elastic distribution is the basis for the reduction of the elastically calculated bending stress by a section factor when comparing calculated stresses to allowable stress levels in subsection NH and other design criteria.
![Steady state Creep stress distribution across a rectangular beam in pure bending [2]](https://whatispiping.com/wp-content/uploads/2024/11/image-89-1024x712.png)
3.7 Creep buckling
The essential difference between elastic and elastic-plastic buckling and creep buckling is that elastic and elastic-plastic buckling occurs with increasing load independent of time, whereas creep buckling is time dependent and may occur even when loads are constant. Elastic and elastic-plastic buckling depends only on the geometric configuration and short-time material response at the time of application. Creep buckling occurs at loads below the elastic and elastic-plastic buckling loads as a result of creep strain accumulation over time.
From Reference [2] shows sensitivity of creep buckling to initial imperfections.
![Creep Buckling Deflection-Time characteristics [2]](https://whatispiping.com/wp-content/uploads/2024/11/image-90.png)
3.8 Negligible Creep Criteria [2]
An important question in Creep analysis is the temperature at which creep becomes significant. In Section 1 and VIII-1, the comparison is between the results provided by the allowable stress criteria based on short-time tensile tests without creep and long-term tests with creep. When the allowable stress as a function of temperature is governed by creep properties, the stress value is italicized in Section II, Part D, Table-1. However in this case, even though the allowable stress is governed by creep properties, the design evaluation procedures do not change.
The situation is different in Section -III-NH. In NH, there are two sets of allowable stresses for primary (load-controlled) stresses to be used in the evaluation of service conditions. One set, 𝑆𝑚 is time independent and a function of short time tensile tests. The other set, 𝑆𝑡 is time dependent and a function of creep. The design rules for time-independent and time-dependent allowable stresses are different. However, it is the rules for displacement-controlled stresses, such as thermally induced stresses that the criteria for negligible creep are the most restrictive.
The NH criteria for negligible creep for displacement-controlled stresses are based on the idea that under maximum stress conditions, creep effects should not compromise the design rules for strain limits for creep-fatigue damage. The key consideration from that perspective is that the actual stress in a localized area can be much greater due to discontinuities, stress concentrations, and thermal stresses than the wall-averaged primary stresses in equilibrium with applied loads. Basically, the magnitude of the localized stress will be limited by the material’s actual yield stress because it is this stress level that the material will deform to accommodate higher stresses due to structural discontinuities or thermal gradients. Thus the objective of negligible creep criteria for localized stresses is to ensure that the damage due to the effects d creep and material’s yield strength will not significantly impact the design rules for the failure mode of concern. For e.g. there are two resulting criteria, one based on negligible creep damage and the other based on negligible strain. For negligible creep rupture damage, the III-NH criteria is given by [2]

In code case N-253, which provides elevated temperature design rules for Class 2 and Class 3 nuclear components, Appendix E contains a figure that shows time and temperature limits below which creep effects need not be considered in evaluating deformation-controlled limits. These curves are lower, smoothed versions of the Subsection NH criteria for negligible creep for a limited number of materials.
Summary
This write-up provides a broad overview of the phenomenon of creep and the way its approached in ASME codes, specially, ASME Boiler and Pressure vessel code SEC-III, Subsection NH. For additional details, interested readers should refer to [2] [3]. Reference [2] forms the basis of this write-up as well as sources of most figures and technical content used in this write-up. The topic of members under compression has not been discussed and details can be found in [2].
References
- Mechanical behavior of materials, 4th Edition, Pearson, by Norman Dowling.
- Design and analysis of ASME boiler and pressure vessel components in the creep range by Maan H. Jawad and Robert I.Jetter, ASME press, 2009.
- ASME Boiler and Pressure vessel code SEC-III-Subsection NH
- Creep of structures, by R.G.Sim, PhD dissertation, University of Cambridge, UK, 1968.
