
Objective
To explain why pipe stress-range calculations might not be correct if pipe support friction is not properly considered. The magnitude of the potential error in stress-range calculation is dependent on the geometry of the pipe layout, the type of supports used, and the coefficient of friction. Margins of potential error in the stress range could be large enough to invalidate the pipe stress analysis.
Most pipe stress software does not give any warning of the potential error discussed below.
Fundamental assumptions for pipe stress analysis
The calculation of stress range is fundamental to every pipe stress analysis. Calculated values of stress range are necessary to assess cyclic loads that could cause fatigue failure of a component in the piping system.
Cyclic loading is the repeated application and removal of temperature, displacement, pressure, or any other mechanical loads. A load cycle consists of two halves.
- i) “Loading”. e.g. From “cold” to “hot” (or “unloaded” to “loaded”)
- ii) “Unloading”. From “hot” to “cold” (or “loaded” to “unloaded”).
A fundamental and implicit definition of a load cycle is that each load cycle must begin and end at the same point and stress state. A particular sequence of loading and unloading is not a cycle if it does not begin and end at the same point and stress state.
The stress difference between “cold” to “hot” is not equal and the opposite to that from “hot” to “cold” is not a stress range. If a stress difference is not a stress range, then it is not valid for use in fatigue and design code calculations.
Design code requirements for stress-range
ASME B31.3 2018 section 319.2.3 Displacement Stress Range sub-section (b) states
“While stresses resulting from displacement strains diminish with time due to yielding or creep, the algebraic difference between strains in the extreme displacement condition and the original (as-installed) condition (or any anticipated condition with a greater differential effect) remains substantially constant during any one cycle of operation. This difference in strains produces a corresponding stress differential, the displacement stress range, that is used as the criterion in the design of piping for flexibility“.
The key phrase from 319.2.3 that is sometimes not considered in pipe stress calculations is “(or any anticipated condition with a greater differential effect)“.
Calculated stress-range
Most pipe stress analysis software calculates the stress difference from the “as installed position” to the first “hot position” (or “loaded position”).
Typical load cases starting from “as-installed‑position” would be
| Load Case | Description | Comments |
| L1 | W + P1 + T1 (Weight + Pressure + Temperature) | Stress and sustained loading in the operating condition. i.e. First “hot‑position” (or “loaded-position”). |
| L2 | W + P1 (Weight + Pressure) | Stress and sustained loading in the “as-installed-position” . |
| L3 | L1 – L2 = (W + P1 + T1) – (W + P1) = T1 | The stress difference caused by temperature change T1 between the “as-installed-position” and “hot-position”. |
The stress-differential L3 can only be used as a stress range for fatigue calculation for a particular load sequence if two conditions are met.
| Condition 1 The stress difference between the “as-installed-position” and “hot-position”. Must be equal and opposite to The stress difference between the “hot-position” and “cold-state position”. |
| AND |
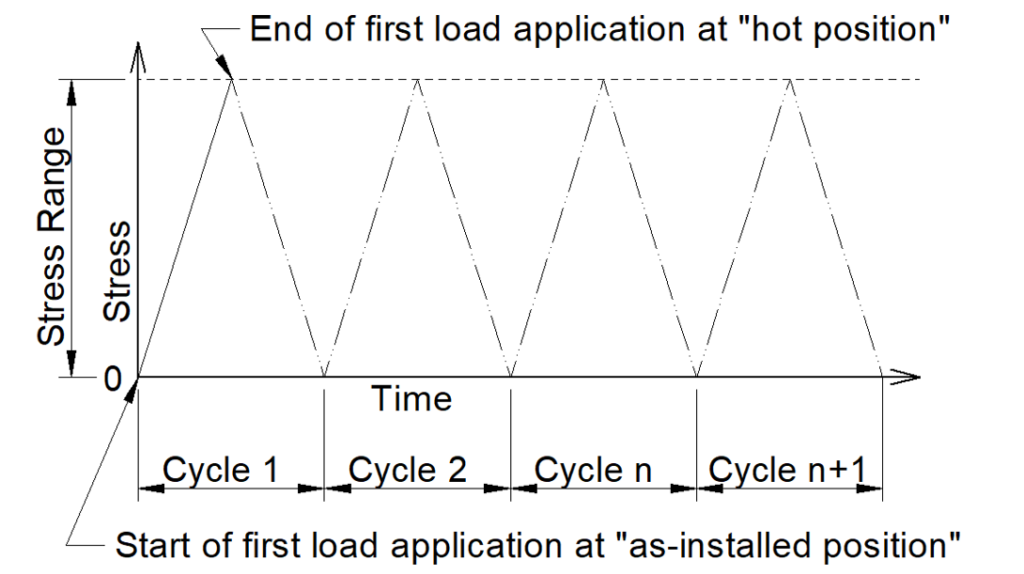
| Condition 2 All subsequent cycles based on the same loading must begin and end at the same points as the first cycle. [See Fig. 1]. |
Therefore, the “cold-state position” must be the same as the “as-installed position”. The pipe system must return to its “as-installed position” after the load has been removed.
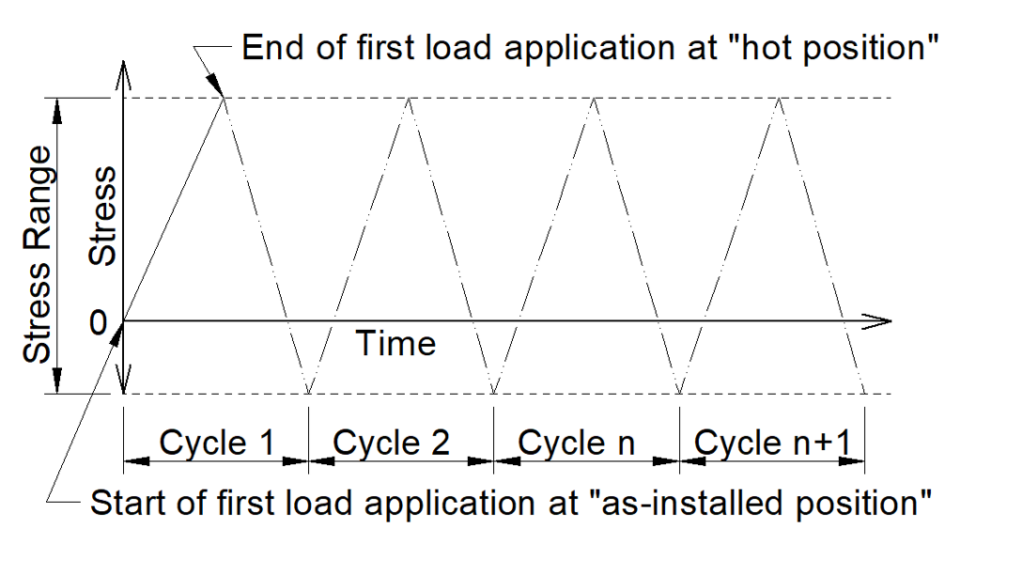
The first half of a loading and unloading sequence is not a stress range if the stress difference is not equal to that of all subsequent cycles for the same sequential load.
[See Fig. 2].
“Cold-state position” is defined for this discussion as the point to which the pipe returns after the removal of thermal or mechanical loads associated with the load sequence being considered.
“Hot position” means the same as “loaded position”.
“Cold-state position” means the same as “unloaded position”.
Accounting for the adverse effects of friction in Stress-range calculations
As discussed above, pipe stress analysis based on stress-range calculations is only correct if the pipe returns to its “as-installed position” at the end of every loading and unloading sequence.
Stress ranges based on the “as-installed position” will only be correct in a real system if:
- a) The pipe system is supported on hanger rods. i.e. The pipe will naturally “swing back” to its “as‑installed position.
- b) The pipe system has no intermediate supports between fixed (anchor) points.
Any sliding support involving friction will prevent the pipe from returning to its “as‑installed position” by some amount.
The only way to ensure that stress-range calculations based on “as-installed positions” are reasonably valid for design is to ensure that the pipe is fully controlled.
Pipe supports must be designed to ensure that the pipe system always returns to “near enough” and its “as-installed position” to ensure errors are within acceptable limits. For example, by fitting guides or line-stops, using hangers, using low friction sliding supports, etc.
Pipe stress software
Default load cases for most pipe stress analysis applications calculate the stress range from the “as‑installed position” to the “first hot position”. Results could be in error if the user is not aware of the effect of friction on stress range.
Some pipe stress applications can calculate the stress difference for both the loading and unloading half-cycles. For example, PASS/START-PROF
The additional functionality enables the user to determine if the unloading half‑cycle is a B31.3 319.2.3 “anticipated condition with a greater differential effect”.
Example
Description:
The purpose of the simplified example pipe system below is to demonstrate the effect of friction on the calculated stress differences discussed above. Two scenarios are considered using identical geometry.
- i) High friction – coefficient of pipe support friction = 0.3
- ii) Low friction – coefficient of pipe support friction = 0.1
Each scenario considers the effect of friction preventing the pipe from returning to its “as‑installed position” after the first “cool-down” (unloading). Each scenario includes load cases to compare stress differences for:
- a) “heat-up” (loading) from the “as-installed position” to the first “hot position”.
- b) “cool-down” (unloading) from the first “hot position” to the “cold-state position”.
This example assumes that the pipe system continues to cycle between the first “hot position” and the “Cold‑state position” at the end of the first load cycle. [See Fig. 2 and Fig. 4].
The effect of “Stiction” has not been considered. However, it is noted that “stiction” will exaggerate the effect of friction discussed here.
Pipe 90 mm OD, 6 mm wall, E = 202713 MPa, n = 0.292, Density = 7833.413 kg/m3, g = 9.807 m/s2,
Full of water (1000 kg/m3) (Arbitrary numerical values for purpose of this example only).
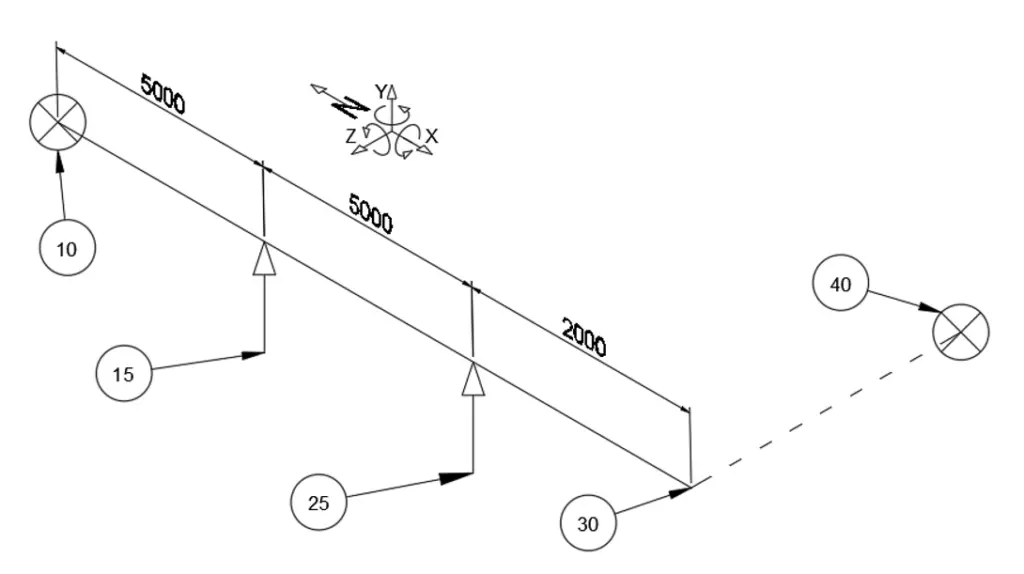
| Node | Description |
| 10 | Anchor |
| 15 | Rest support, with friction |
| 25 | Rest support, with friction |
| 30 | RY rotational restraint to represent the mutual rotational restraint of legs 10 – 30 and 30 – 40 Displacement DZ 100 mm “hot”, 0 mm displacement “cold”. |
| 30 – 40 | Represents a straight section of pipe. The expansion of 30 – 40 would cause 30 to expand 100 mm in Z direction. (The axial expansion of 10 to 30 is ignored for simplicity of calculation) |
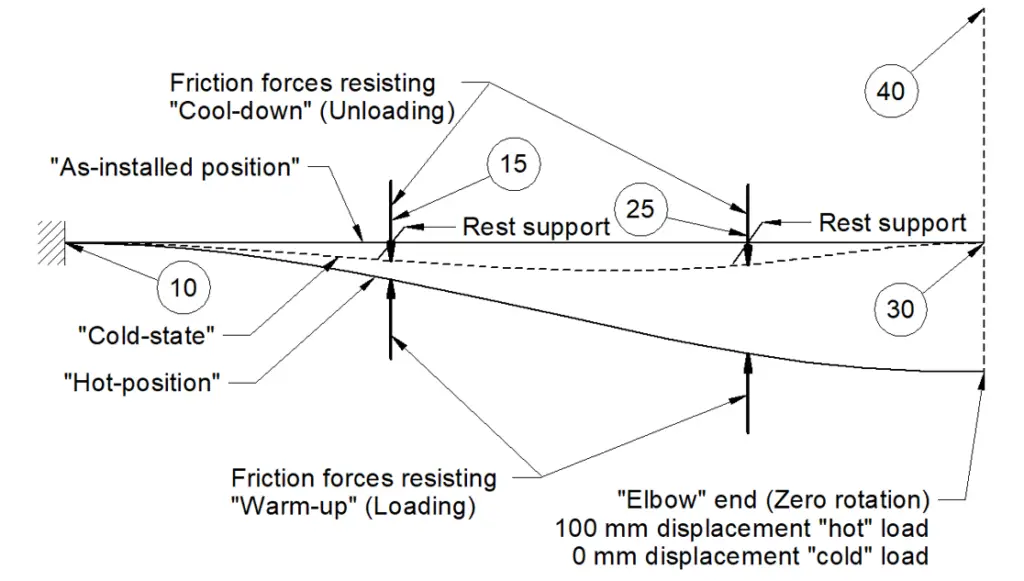
Table 1 Results (Manual calculation) Friction Coefficient = 0.1 [See Figure 4]
| Load case/loads | Unit | 10 | Node 15 | Node 25 | Node 30 |
| LC1 W + D1 + F1 “hot position” Deflection DZ | mm | 0 | 34.7 | 91.6 | 100 |
| LC2 W (Sustained) Support loads FY | N | 418 | 849 | 756 | – |
| LC3 W + D2 + F2 “cold-state postion” Deflection DZ | mm | 0 | 3 | 1 | 0 |
| F1 Friction forces resisting “heat up” m = 0.1 x self weight Z direction, added as a force to simulate friction. | N | – | -85 | -76 | – |
| F2 Friction forces resisting “cool-down” m = 0.1 x self weight Z direction, added as a force to simulate friction. | N | – | 85 | 76 | – |
| LC4 = L1 – L2 (“Hot Position” minus “As-installed” position) | MPa | 33.1 | 10.5 | 26.6 | 45.1 |
| LC5 = L1 – L3 (“Hot Position” minus “cold-state” position) | MPa | 27.8 | 14.6 | 26.7 | 51.8 |
| LC3 – LC2 (“Residual stress” in “cold-state” position) | MPa | 5.3 | -4.1 | -0.1 | -6.7 |
| LC5 – LC4 Error in “stress-range” calculation based on “as‑installed” position | MPa | 5.3 (-16%) | 3.9 (44%) | 0.1 (0%) | 6.7 (15%) |
| D1 = DZ deflection at node 30 = 100 mm, D2 = DZ deflection at node 30 = 0 mm |
Table 2 Results (Manual calculation) Friction Coefficient = 0.3 [See Figure 4]
| Load case/loads | Unit | Node 10 | Node 15 | Node 25 | Node 30 |
| LC1 W + D1 + F1 “hot position” Deflection DZ | mm | 0 | 28.8 | 89.7 | 100 |
| LC2 W (Sustained) Support loads FY | N | 418 | 849 | 756 | – |
| LC3 W + D2 + F2 “cold-state postion” Deflection DZ | mm | 0 | 8.9 | 2.9 | 0 |
| F1 Friction forces resisting “heat up” m = 0.3 x self weight Z direction, added as a force to simulate friction. | N | – | -255 | -227 | – |
| F2 Friction forces resisting “cool-down” m = 0.3 x self weight Z direction, added as a force to simulate friction. | N | – | 255 | 227 | – |
| LC4 = L1 – L2 (“Hot Position” minus “As-installed” position) | MPa | 22.5 | 18.7 | 26.0 | 58.5 |
| LC5 = L1 – L3 (“Hot Position” minus “cold-state” position) | MPa | 6.6 | 31 | 26.4 | 78.5 |
| LC3 – LC2 (“Residual stress” in “cold-state” position) | MPa | 15.9 | -12.3 | -0.4 | -20.0 |
| LC5 – LC4 Error in “stress-range” calculation based on “as‑installed” position | MPa | 15.9 (-71%) | 12.3 (66%) | 0.4 (1%) | 20 (34%) |
| D1 = DZ deflection at node 30 = 100 mm, D2 = DZ deflection at node 30 = 0 mm |
Table 3 Results (PASS/START-PROF) Friction Coefficient = 0.1 [See Figure 4]
| Load case / loads | Unit | Node 10 | Node 15 | Node 25 | Node 30 |
| LC1 W + D1 + F1 “hot position” Deflection DZ | mm | 0 | 34.7 | 91.6 | 100 |
| LC2 W (Sustained) Support loads FY | N | 420 | 847 | 754 | – |
| LC3 W + D2 + F2 “cold-state postion” Deflection DZ | mm | 0 | 3 | 1 | 0 |
| Friction forces F1 resisting “heat up” m = 0.1 x self weight Z direction, added as a force to simulate friction. | N | – | -84 | -76 | – |
| Friction forces F2 resisting “cool-down” m = 0.1 x self weight Z direction, added as a force to simulate friction. | N | – | 84 | 76 | – |
| LC4 = L1 – L2 (“Hot Position” minus “As-installed” position) | MPa | 32.9 | 10.4 | 25.6 | 44.9 |
| LC5 = L1 – L3 (“Hot Position” minus “cold-state” position) | MPa | 27.6 | 14.5 | 25.7 | 51.5 |
| LC5 – LC4 Error in “stress-range” based on “as‑installed” position | MPa | 5.3 (-16%) | 14.5 (39%) | 0.1 (0.031% | 6.7 (15%) |
Table 4 Results (PASS/START-PROF) Friction Coefficient = 0.3 [See Figure 4]
| Load case / loads | Unit | Node 10 | Node 15 | Node 25 | Node 30 |
| LC1 W + D1 +F1 “hot position” Deflection DZ | mm | 0 | 28.8 | 89.7 | 100 |
| LC2 W (Sustained) Support loads FY | N | 420 | 847 | 754 | – |
| LC3 W + D2 + F2 “cold-state” postion Deflection DZ | mm | 0 | 8.9 | 2.9 | 0 |
| Friction forces F1 resisting “heat up” m = 0.3 Z direction, added as a force to simulate friction. | N | – | -252 | -225 | – |
| Friction forces F2 resisting “cool-down” m = 0.3 Z direction, added as a force to simulate friction. | N | – | 253 | 227 | – |
| LC4 = L1 – L2 (“Hot Position” minus “As-installed” position) | MPa | 22.4 | 18.5 | 25.9 | 58 |
| LC5 = L1 – L3 (“Hot Position” minus “cold-state” position) | MPa | 6.6 | 30.7 | 26.3 | 78 |
| LC5 – LC4 Error in “stress-range” based on “as‑installed” position | MPa | 15.8 (-70%) | 12.2 (66%) | 0.4 (1%) | 20 (34%) |
Discussion of results
Table 1 – Support friction m = 0.1
Table 1 lists deflections and stress differences for load cycling with pipe support friction m = 0.1.
- i) “As-installed to “hot‑position”. (Load case LC4). i.e. Warm-up (loading).
- ii) “Hot position to “cold-state”. (Load case LC5). i.e. Cool-down (unloading).
Results are calculated based on the classical beam formula using Mathcad. (An identical Autodesk Nastran beam element model produced nearly identical results).
The stress difference for warm-up load case LC4 is less than the stress difference for cool‑down load case LC5. (Except for node 10). Therefore, LC4 cannot be used as the basis for the maximum system “stress range” as discussed above. [See Fig. 2].
If the system continues to cycle between “hot-position” and “cold‑state position”, then load case LC5 would be defined as the stress range. [See Fig. 2]. i.e. A maximum stress range of 51.8 MPa. (15% higher than 45.1 MPa calculated for load cycles between the “as-installed position” and “hot‑position”).
It is noted that the LC5 stress difference at node 10 is reduced by friction. The higher stress difference at node 10 for LC4 is not a stress range for the reasons discussed. However, in general, LC4 would still need to be checked as a single application.
Table 2 – Support friction m = 0.3
Table 2 results are the same as Table 1 discussed above but for m = 0.3.
Similarly, if it can be assumed that the pipe returns to the “hot position” after cooling to the “cold‑state position”, then load case LC5 would be the stress range. [See Figure 2]. i.e. A maximum stress range of 78.5 MPa. (34% higher than 58.5 MPa calculated for load cycles between the “as-installed position” and “hot‑position”).
PASS/START-PROF pipe stress analysis software (For comparison)
Table 3 and Table 4 show PASS/START-PROF results equivalent to Table 1 and Table 2 respectively. PASS/START-PROF results show a close correlation with the manual calculations and general-purpose FE beam analysis (Autodesk Nastran 2021).
Summary
- Stress ranges used for fatigue analysis require that the stress difference for warm‑up (loading) is the same as that for cool-down / unloading. In other words, the stress difference for warm-up/loading from the “as-installed position” is not a stress range if it is different than the stress difference for subsequent load cycles.
- The stress difference during warm-up (loading) from its “as-installed position” is only valid as a stress range if the pipe system can be guaranteed to return precisely to the same position during cool‑down (unloading) for all subsequent load cycles.
- This discussion used a simple example to demonstrate that pipe stress-range calculation based on the “as‑installed position” can be significantly in error if friction prevents the pipe from returning to the “as-installed position” after cool-down / unloading.
- The magnitude of the error depends on the coefficient of friction, the pipe layout, and the type of pipe supports used. The use of guides, line-stops, and other methods of controlling pipe movement has a significant effect on the magnitude of any potential error.
- Care must be taken when guides or other pipe supports controlling movement are removed to reduce the calculated displacement stresses and loads from the “as-installed position”. For example, removing guides from sliding supports to reduce calculated over-stress caused by seismic anchor movements.
- Pipe stress theory and piping design codes both require that the most onerous stress range is used for purpose of assessing the fatigue life of a piping system for safe operation over its design lifetime.
B31.3 2018 section 319.2.3 states “While stresses resulting from displacement strains diminish with time due to yielding or creep, the algebraic difference between strains in the extreme displacement condition and the original (as-installed) condition (or any anticipated condition with a greater differential effect) remains substantially constant during any one cycle of operation. This difference in strains produces a corresponding stress differential, the displacement stress range, that is used as the criterion in the design of piping for flexibility“.
In the author’s experience, B31.3 319.2.3 is sometimes interpreted to mean only “the extreme displacement condition and the original (as-installed) condition”.
However, B31.3 actually states “the algebraic difference between strains in the extreme displacement condition and the original (as-installed) condition (or any anticipated condition with a greater differential effect) remains substantially constant during any one cycle of operation”.
The simple example above demonstrates that a failure to consider the phrase “(or any anticipated condition with a greater differential effect)” in B31.3 319.2.3 can lead to very different and potentially inaccurate calculation results.
** Future parts of “Pipe stress range calculated correctly?” will discuss how calculated stress range is affected by real changes of pipe support friction over the plant life. For example, what happens to the validity of a stress calculation if one pipe support rusts more than another?