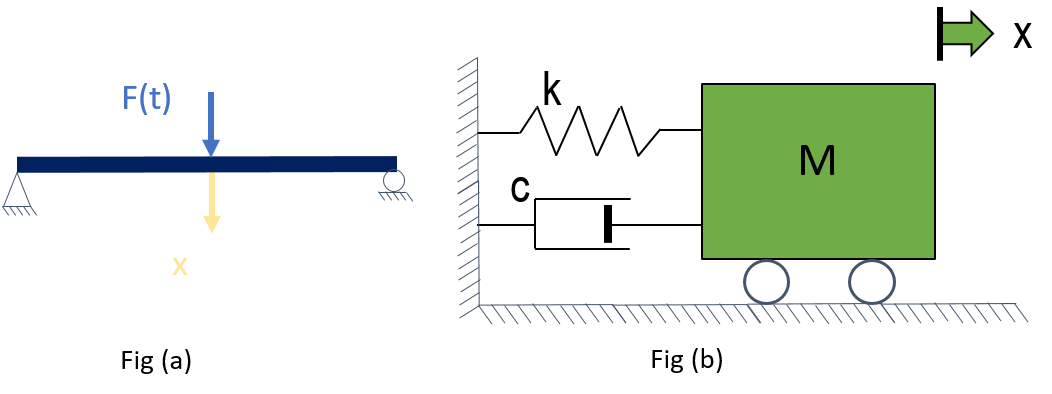
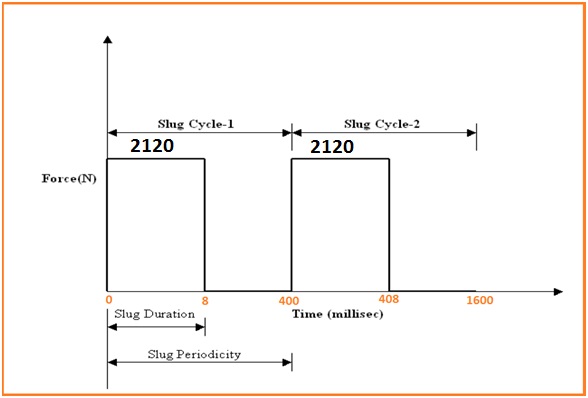
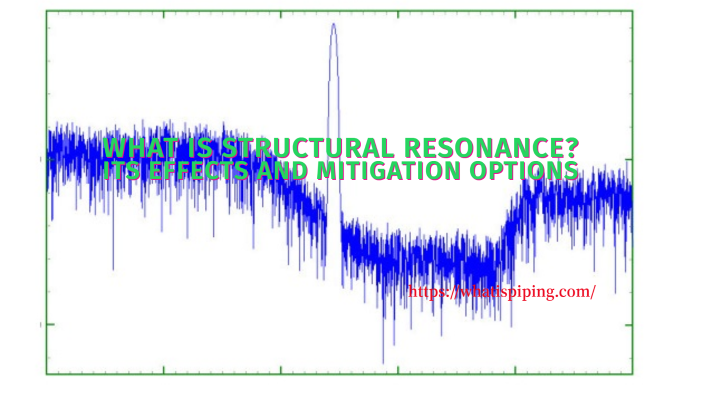
A response spectrum is a graphical plot of the frequency of an oscillator and its damping. The response spectrum plot represents the peak or steady-state response (velocity, displacement, or acceleration) of a series of oscillators of varying natural frequencies. In the vibration analysis of any system, the response spectrum is very useful as the resulting plot can provide the response of any linear system with respect to its natural frequency. The response spectrum finds its usage in interpreting seismic or earthquake events and slug flow events.
Response Spectrum Analysis is a scientific method for estimating the structural response of dynamic vibration events. To perform the response spectrum analysis, the first job is to define the response spectrum of the system. In this article, we will explore the basics of the response spectrum and learn the steps for performing seismic/earthquake analysis using the response spectrum analysis method.
What is an earthquake?
Earthquakes are random ground motion that produces inertial loads in structures built on them. The ground motion of the earthquake can be attenuated by the building’s resonant response producing much larger motions at higher levels. That leads to major damage to the structure. Hence, structures need to be designed to withstand the earthquake’s ground motion.
Static vs Dynamic Seismic Analysis
This earthquake analysis of piping systems can be performed in two ways: by static method or dynamic way
Static Equivalent Seismic Analysis:
Static equivalent analysis, for most non-critical piping systems, the earthquake is treated as a static load, which is proportional to the weight of the piping and components. The magnitude of the load is generally determined by the ‘g’ factor according to respective codes, for example, UBC, IBC, ASCE, IS, etc. This load is applied statically in the vertical and two horizontal directions.
Dynamic Earthquake Analysis
Dynamic Analysis, for critical piping systems, a dynamic analysis is generally preferred because that produces more realistic and accurate results compared to an equivalent static analysis. The random ground motion can be recorded using accelerometers and applied to the structure or piping model through all the ground supports as time histories and the effect can be assessed. These random ground motions are converted to response spectra to simplify earthquake analysis.
For seismic analysis of piping and structures, the earthquake response spectrum is the most popular tool. For predicting forces and displacements of pipes and structures, the response spectrum method provides various computational advantages. The main benefit of the seismic response spectrum method is the calculation of only the maximum displacement and force values in each mode of vibration using smooth design spectra that are the average of several earthquake motions.
Response Spectrum Analysis Method
Response spectrum plot gives the maximum response (that maybe maximum displacement, maximum velocity, maximum acceleration, or any other parameter of interest) to the natural frequency (or natural period) subjected to specified excitation for linear single-degree-of-freedom system oscillators. These plots are subjected to specific damping and it changes as damping changes. Refer to Fig. 1 shown below:
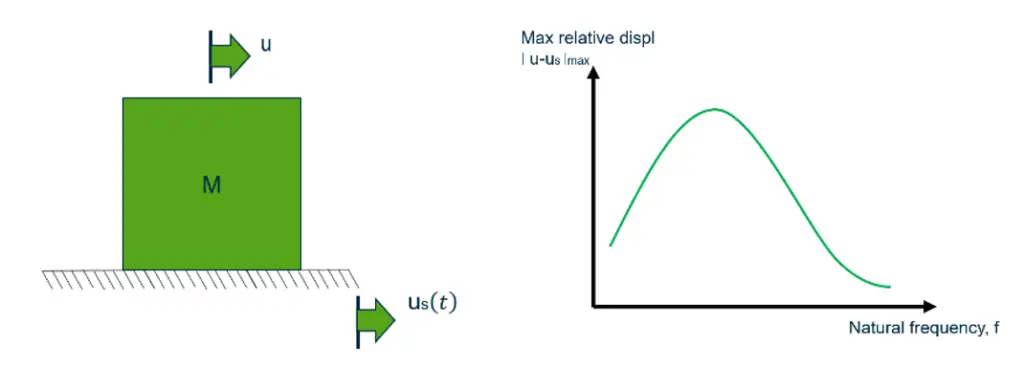
Here abscissa is the natural frequency (or period) of system and ordinate is the maximum response.
The plot of this type is shown here in the figure, in which a one-story building is subjected to a ground displacement indicated by us(t) and u indicates deflection.
For any linear single degree of freedom system, the response spectrum curve shown in the figure gives the maximum displacement of the mass m relative to the displacement at the support which is (us-u) here.
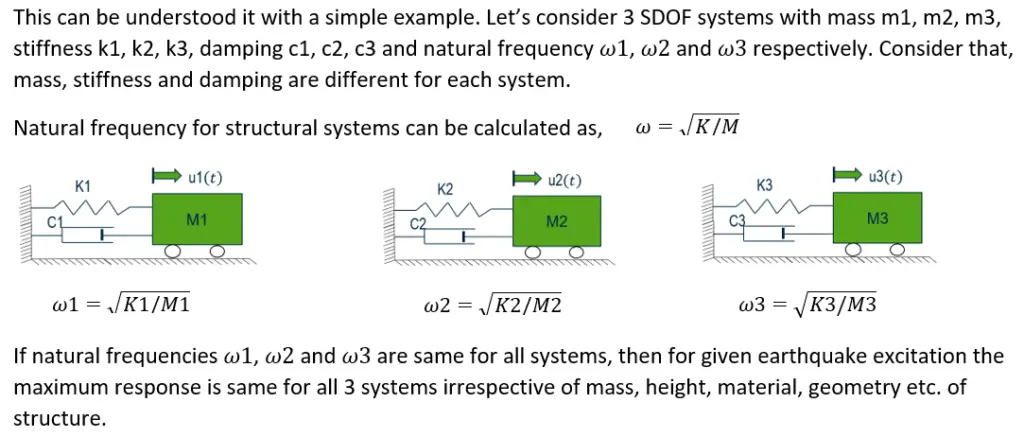
Thus, to determine the maximum response of a linear single degree of freedom system from the available spectral chart, for specified earthquake excitation, one needs only to know the natural frequency of the system and damping.
If the natural frequency of the structure coincides with the frequency of earthquake ground motion, it leads to a resonance condition, which creates substantial damage to the system. That’s the main reason, not all buildings collapse during an earthquake. The natural frequency of building/structure is a property of height, stiffness, material, etc. Buildings whose natural frequency matches with earthquake frequency collapse during an earthquake while remaining are not experiencing major damage.
The response spectrum is using the same principles as time history. Only instead of using time history, it is using maximum values of the response. When the time history profile is not available for a particular dynamic event, then the response spectrum is used. Response spectrum analysis provides more conservative results than time history.
Parameters affecting Response Spectra
The response spectral values are dependent on various factors like,
- Soil condition
- Energy release mechanism
- Damping in the system
- Epicentral distance
- Focal depth
- Richter magnitude
- The time period of the system
Construction of Response Spectrum Plot
The construction of a Response Spectrum requires the solution of a single degree of freedom system, for a sequence of natural frequency values and damping ratio in the range of interest. Every solution provides only one point (with the maximum value) of the response spectrum. All of these maximum response values are plotted against natural frequency to construct a single response spectrum.
Since a large number of systems must be analyzed in order to fully plot each response spectrum, the task is lengthy and time-consuming. But once these curves are constructed and available for the excitation of interest, the analysis for the design of structure subjected to dynamic loading is reduced to a very simple calculation of the natural frequency of the system and the use of response spectrum to calculate the maximum response.
These response spectrum plots are created for specific areas of regions and different for different regions. The study of geographic areas combined with an assessment of historical earthquakes allows geologists to determine seismic risk and to create seismic hazard maps for respective areas, which show the likely maximum response values to be experienced in a region during an earthquake.
So, let’s look at a simplified example of how we can get a response spectrum plot for a specific area of the region.
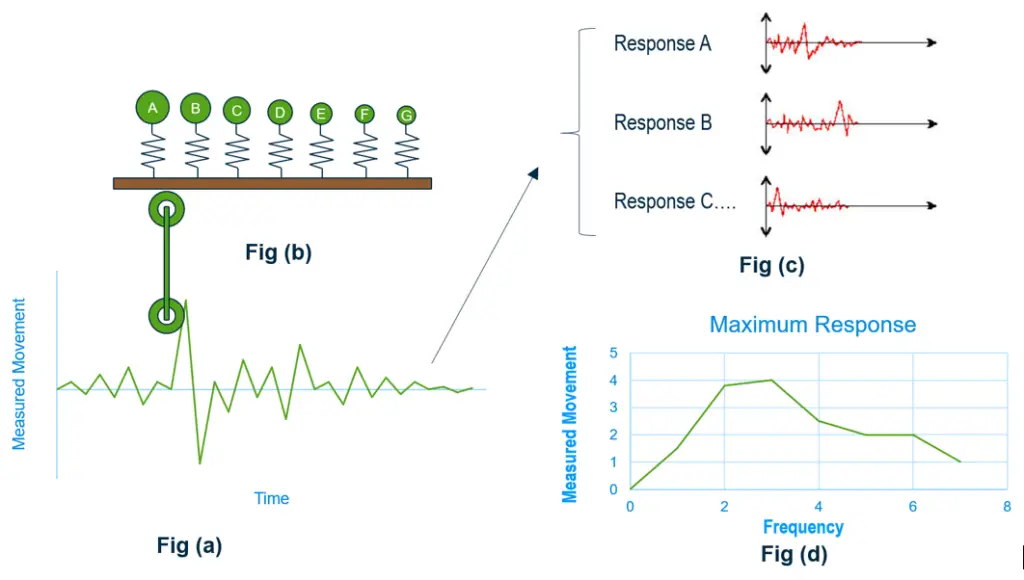
- Step 1: First, take the randomly measured ground motion from previous earthquake records in that area. (Fig a)
- Step 2: Then sequence of tuned SDOF oscillators with some fixed damping values attached to a shaker table and measured motion used to shake the table. (Fig b)
- Step 3: The response of all the SDOF oscillators is recorded and plotted for an individual oscillator. (Fig c)
- Step 4: Maximum response for all individual oscillators is extracted to plot the combined response. (Fig d)
Calculating the maximum response for a range of values of frequency and damping and then plotting results graphically to get a spectrum chart that shows the maximum response for all possible single-degree-of-freedom systems to that component of the earthquake. This maximum response can be maximum displacements, maximum velocity, or maximum acceleration.
This combined response is made up of many peaks and troughs. The envelope of the broadened peaks is shown in fig (d), which is a conservative approach. The idea is that even though all earthquakes are different, the maximum response of similar earthquakes should be the same even though the time the maximum response occurs may differ i.e. timing of the event is not considered.
Seismic engineers and government planning departments use these values from the spectrum chart to determine the appropriate earthquake loading for buildings in the respective zone. Earthquake load impact calculations for any structure in that area of the region are simplified into a few steps to (a) calculate the natural frequency of the system, (b) and then the maximum response found from the respective spectrum chart for calculated natural frequency.
Pseudo-acceleration and Pseudo-velocity
Response spectrum plots can be plotted as maximum relative displacement, maximum velocity, or maximum acceleration. These three quantities are also known as spectral displacement (SD), Spectral velocity (SV), and Spectral acceleration (SA) and are also proportional to each other.
The spectral displacement i.e. maximum relative displacement is proportional to spectral acceleration i.e. maximum absolute acceleration. This can be demonstrated with simple numerical iterations on the dynamic equation of motion.
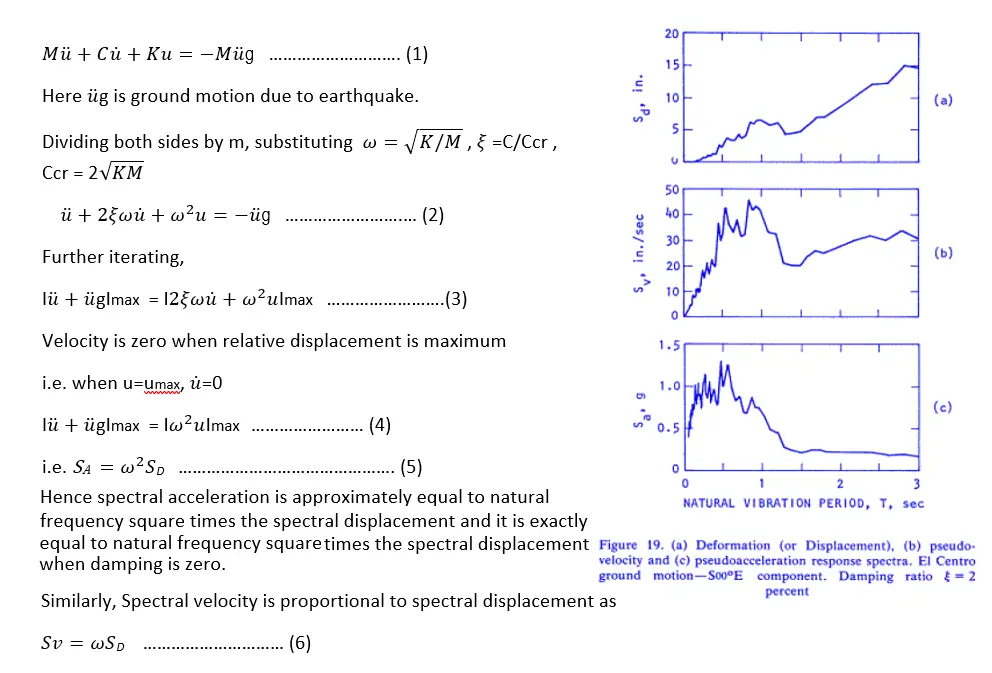
And this can be demonstrated by equating the equation for potential energy and kinetic energy.
The acceleration and velocity so defined are called pseudo-acceleration and pseudo-velocity, respectively. Pseudo-acceleration is very close to absolute acceleration and is the same as absolute acceleration when there is no damping. Pseudo-velocity is the fictitious velocity associated with the apparent harmonic motion for convenience.
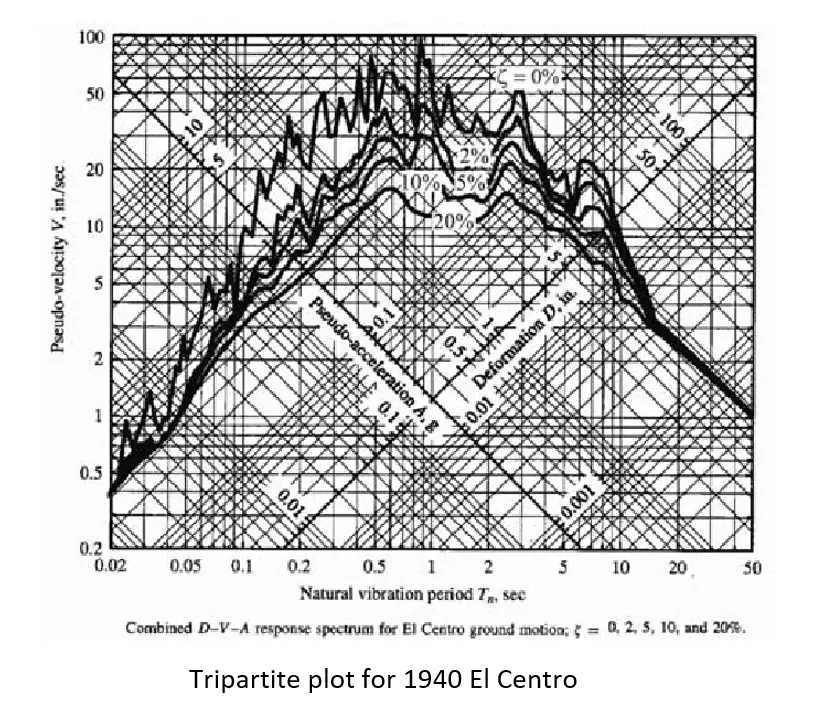
Tripartite Response Spectra
It is possible to plot all three responses in a single chart using a logarithmic scale and it is called the Tripartite plot (Fig. 3)
Dynamic Equation of Motion and Modal Superposition
The dynamic behavior of a piping system depends greatly on the free or natural vibration of the system. SDOF system deals with one natural frequency and this system can only move in one particular direction. However, in a multi-degree of freedom (MDOF) structural system, such as a piping system, there are many natural frequencies, each with its vibration shape or mode. These MDOF structures with N degrees of freedom system transformed into the problem of solving N systems, in which each one is an SDOF system. This transformation extends the use of response spectra from a single-degree-of-freedom system to the solution of the system with any number of degrees of freedom.
The equation of dynamic equilibrium associated with the response of the structure subjected to ground motion is as below.
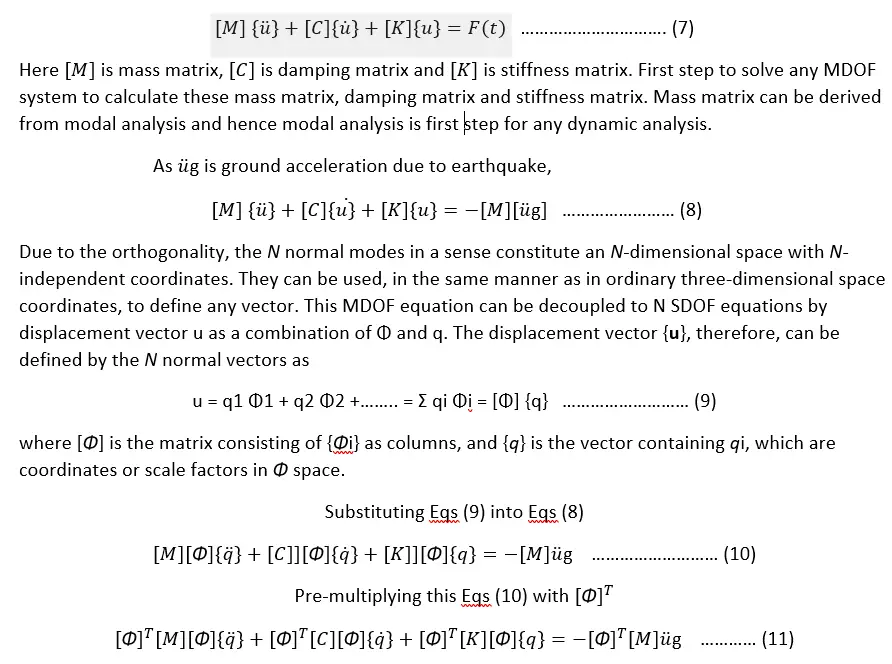
Due to modal orthogonality, M, C, and K matrices will become diagonal matrices. The modal superposition converts the N simultaneous differential equations of the MDOF system into N-independent SDOF systems by decoupling this equation. These N-independent SDOF systems are solved one by one using SDOF techniques.
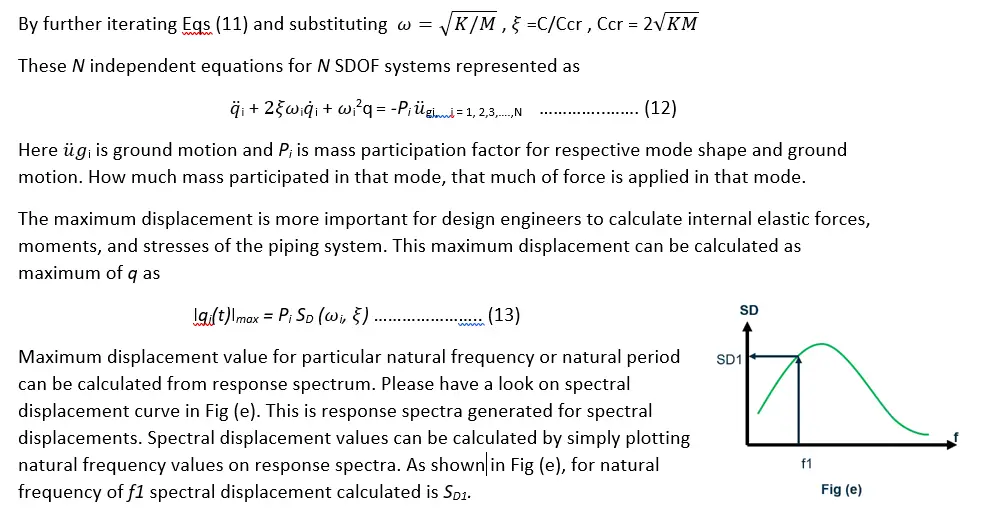
The maximum displacement in time history response can be calculated by multiplying the maximum displacement calculated from the response spectrum with the participation factor for the respective mode shape. Each mode shape is contributing up to some extend to the total response of the structure and that depends on the participation factor. Accordingly, the maximum response is calculated for all respective modes.
The amount of displacement in one mode given by,

Accordingly, the maximum time history response is calculated for all modes and respective ground motions and combined together to get maximum earthquake response. These maximum time history responses cannot be added directly and for that special techniques called modal combinations are used.
Modal Combinations
The total response of the system is determined by combining the responses from all modes. This combination is termed a modal combination. The modal combination includes internal modal forces and internal modal moments, as well as modal displacements.
Ed Wilson and Ray Clough took the response spectra method and developed the approximate method for MDOF structures that requires the combination of the modes and proposed SRSS over 50 years ago. At that time only 3 earthquake records existed for comparison whereas now we have thousands.
The methods of combining modal results present some confusion to many piping engineers. We have the SRSS (Square Root of Sum of Square), ABS (Absolute), CQC (Complete Quadratic Combination), and a few algebraic methods. They all have been used in one situation or another. However, we do not really have a clear picture of when and why a certain method is used.
The NRC Regulatory Guide 1.92 provides further guidance for nuclear facilities. Some of the methods are from Rev 1 and some are from Rev 2 with some standard mathematical methods.
- Square Root of the Sum of the Squares (SRSS)
- Grouping Method
- Ten Percent Method
- Absolute Double Sum Method
- Signed Double Sum Method
- Absolute CQC
- Signed CQC
Steps to perform Response Spectrum analysis in AutoPIPE
- Open Model in AutoPIPE from, File>Open. Note: The first step for any Dynamic analysis is modal analysis.
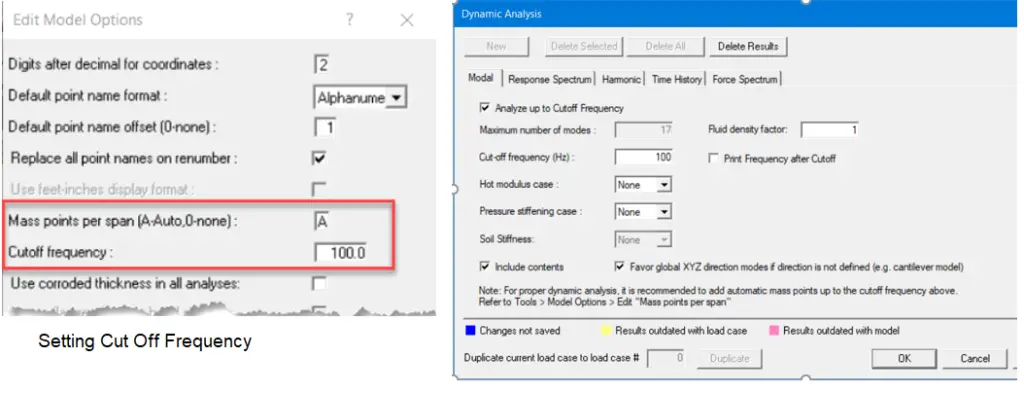
- Go to Tools > Edit Option and make these changes:
- Mass point per span (A-Auto, 0-None): A
- Cutoff frequency: 100
- Then click OK to accept.
Note: Specifying ‘A’ means that the mass spacing will be applied automatically using a frequency of 100Hz. It is possible to split each length into the same number of spans by using a number in the range 1-9 instead of A, but this can lead to very closely spaced nodes in short lengths.
- Go to Analysis > Dynamic analysis to set up dynamic analysis settings
- Under Modal analysis, check on Analyze up to Cutoff frequency and Provide cutoff frequency value. Review other information if you want to make modifications over there. And then click OK
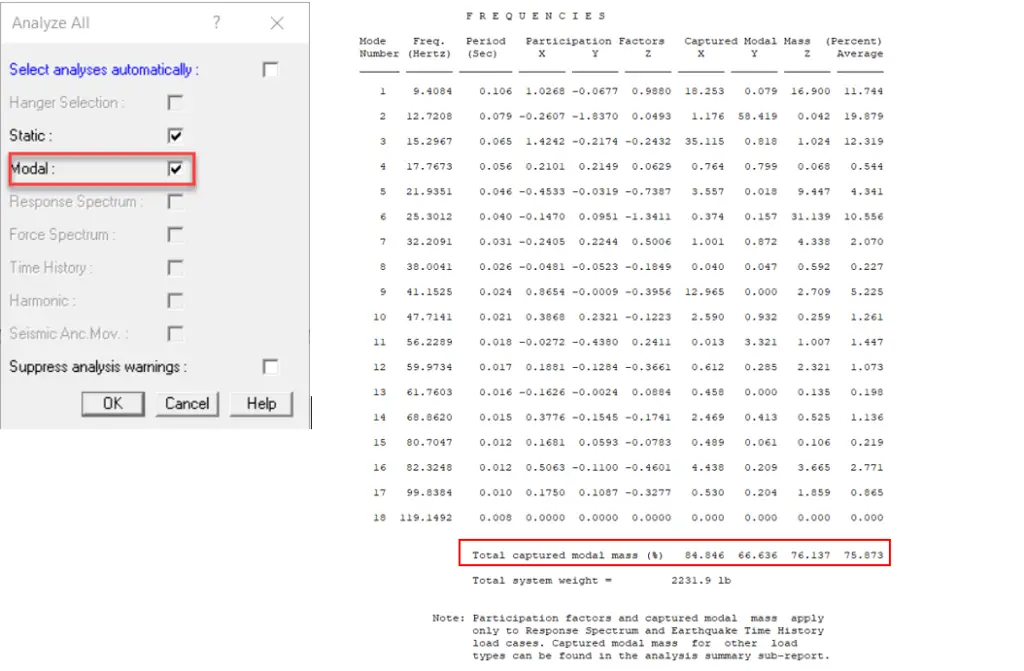
Then click on Analyze all from the Analysis ribbon. Make sure that Modal analysis is selected and click ‘OK’.
Check for adequate mass participation. Go to Result > Output Report, select Frequency report and click ‘OK’ to access reports.
The next step is to create a Response spectrum. Go to Loads>Response Spectrum. Here you can provide a new Response Spectrum Or can use an existing one.
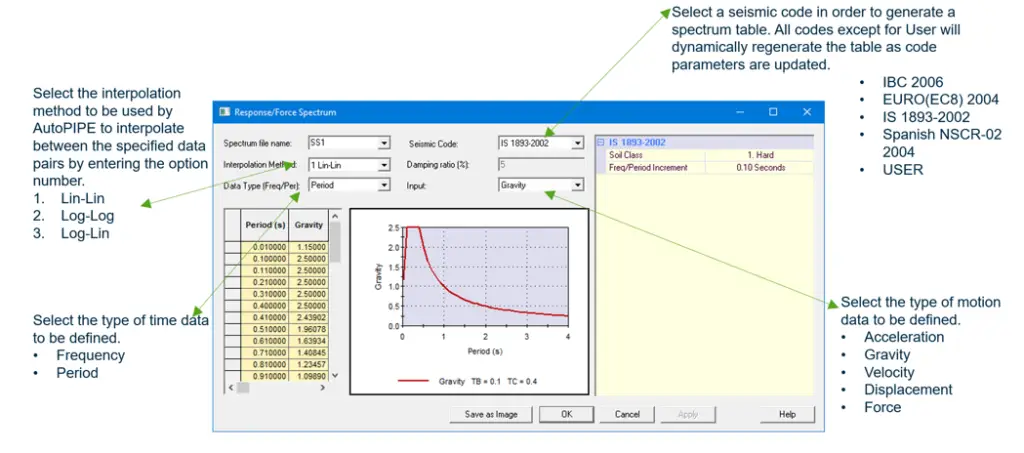
Note: You can provide a number of response spectra together. This spectrum data can be copy pasted from MS Excel. Also, you can construct spectrum may as an external ASCII text file using any text editor software.
- Now go to Analysis>Dynamic analysis>Response Spectrum.
- Create a new load case by clicking on ‘New’. Then click on Spectra>Define.

Missing mass correction can be considered by checking on ZPA or Missing Mass field. Then from the dropdown select Modal Combination type for calculations. Check on ‘Print Modal Results’ and click ‘OK’.
Note: Different Response spectra can be provided for each direction. Also, scale factors can be modified.
- To analyze the model for Response Spectrum, click on Analyze All in the Analysis ribbon. Please make sure the Response Spectrum is selected here.
- After analysis, Go to Result>Combinations.
- A new load case is created for Response Spectrum, Response 1 (R1)
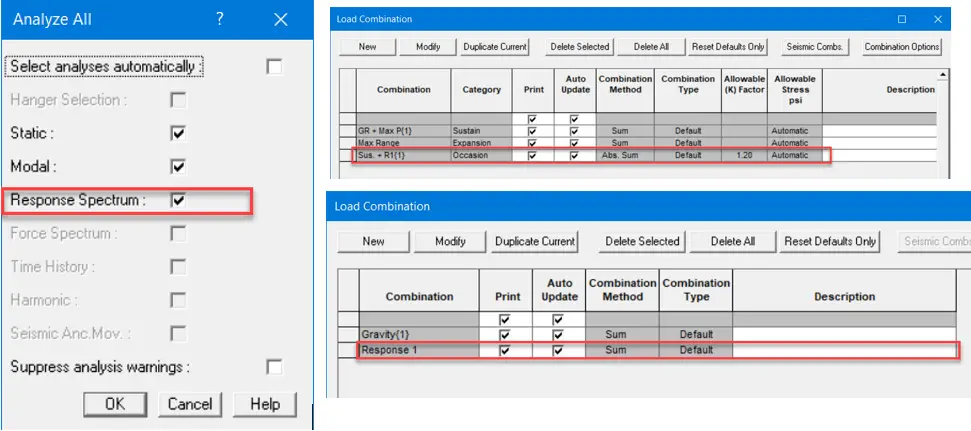
Code Combinations are used to check code stresses whereas Non-Code Combinations are to check forces and moments. Code combination Sus+R1 and Non-code combination R1 are created automatically by AutoPIPE. This R1 we can further combine with other operating cases.
- These results can also be checked graphically,
- Code stresses, Go to Result>Code Stresses, and then select Sus+R1 as combinations.
- Displacements, Go to Result>Displacement and then select Response 1 as Load combination.
- Detailed text reports for Response, Mode Shapes, Restraint Reactions, and Accelerations can get from Quick reports.
- Go to Result>Quick Reports>Output Report and select Frequency, Mode Shapes, Restraint, and Accelerations.
Results and Interpretations of Response Spectrum Analysis Outputs
This maximum response can be found from provided response spectrum and modal analysis results as explained in the Dynamic Equation of Motion and Modal Superposition theory.
Modal analysis results provide different modes of natural frequency and participation factors.
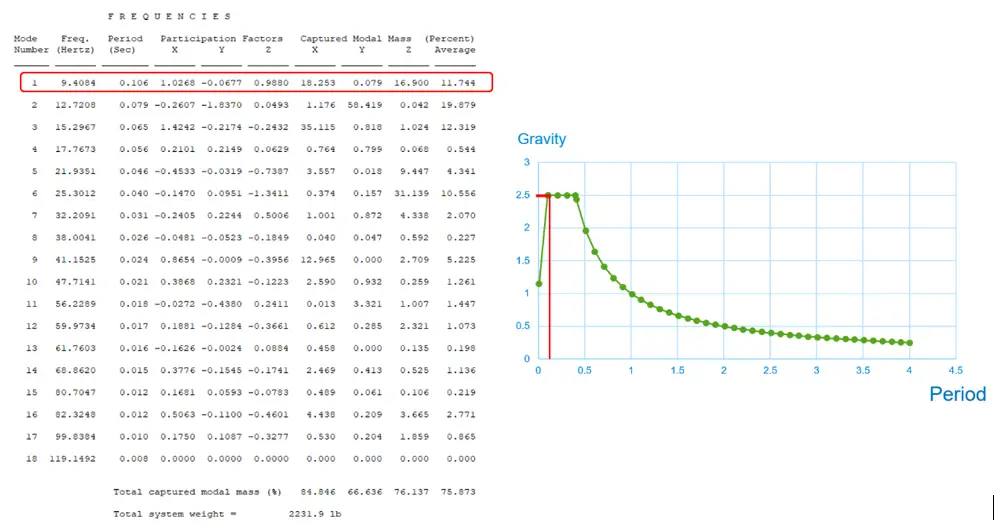
By simply, plotting the period (or natural frequency) value on spectra, the maximum response is calculated. This maximum response is multiplied by the participation factor to calculate the maximum time history response in the respective mode. Accordingly, maximum responses are calculated for all modes and combined by Modal combinations to get a maximum response due to earthquake loading at all points.
About the Author: This article is prepared by Mr. Manoj Kale, AutoPipe Expert. He presented this article in the form of a webinar. To access the recording of that webinar and learn directly from the expert, Click here and register.

