Instrumentation engineering plays a crucial role in the oil and gas industry, ensuring the safe, efficient, and reliable operation of facilities across exploration, production, refining, and distribution. Instrumentation engineers are responsible for the design, implementation, testing, and maintenance of various measurement, control, and automation systems that regulate operations. These engineers work on a broad range of projects, including offshore platforms, refineries, gas plants, and storage facilities, providing essential solutions for managing pressure, temperature, flow, and level controls, as well as gas detection and safety systems.
What are Instrumentation Engineering Deliverables?
The deliverables in instrumentation engineering for the oil and gas industry refer to the comprehensive technical documents, designs, and systems that outline the specifications, functionalities, and implementation procedures of the instrumentation systems. These deliverables are vital to ensuring that the facility meets safety standards, regulatory compliance, operational efficiency, and environmental protection. Let’s learn some of the key instrumentation engineering deliverables that are most frequently used in the oil and gas industry.
- Piping and Instrumentation Diagram (P&ID)
- Instrument Index
- I/O List
- Instrument Specification and Datasheet
- Instrument Loop Diagrams
- Instrument Hook-Up Diagrams
- Instrument Cable Schedule
- Instrument Logic Diagrams
- Cause and Effect Diagrams
- Field Instrument Layout
- Control System Architecture Documentation
- Hazardous Area Classification
- Testing and Commissioning Plans
- As-Built Drawings and Documentation
1. Piping and Instrumentation Diagram (P&ID)
A P&ID, or Piping & Instrumentation Diagram, is a schematic representation of the functional relationship of piping, instrumentation, and system equipment components. P&ID shows all piping, including the physical sequence of branches, reducers, valves, equipment, instrumentation & control interlocks. Even though it is prepared by process engineers, most of the instrument-related inputs are shared by instrumentation engineers. More details about P&ID are covered here: What is a P&ID Drawing | P&ID Symbols | How to Read P & ID Drawings

2. Instrument Index
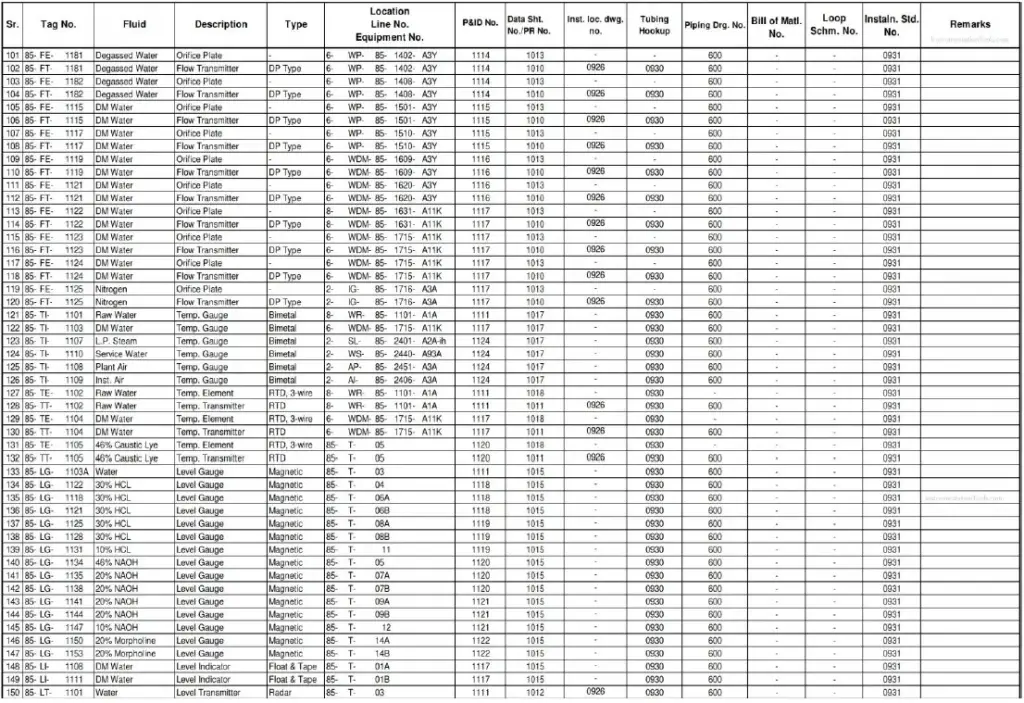
The Instrument Index is made to list all the instruments loop-wise on the basis of P&ID. It covers all the necessary information of the instruments in the loop. The major data that must be included in an Instrument Index are
- Tag Number
- Description of the Instrument
- Service
- Type of Instrument
- Location of Instrument
- P&ID Number
- Instrument Specification Number
- Hook-up Diagram Number
- Instrument Layout Number

3. I/O List (Input-Output List)
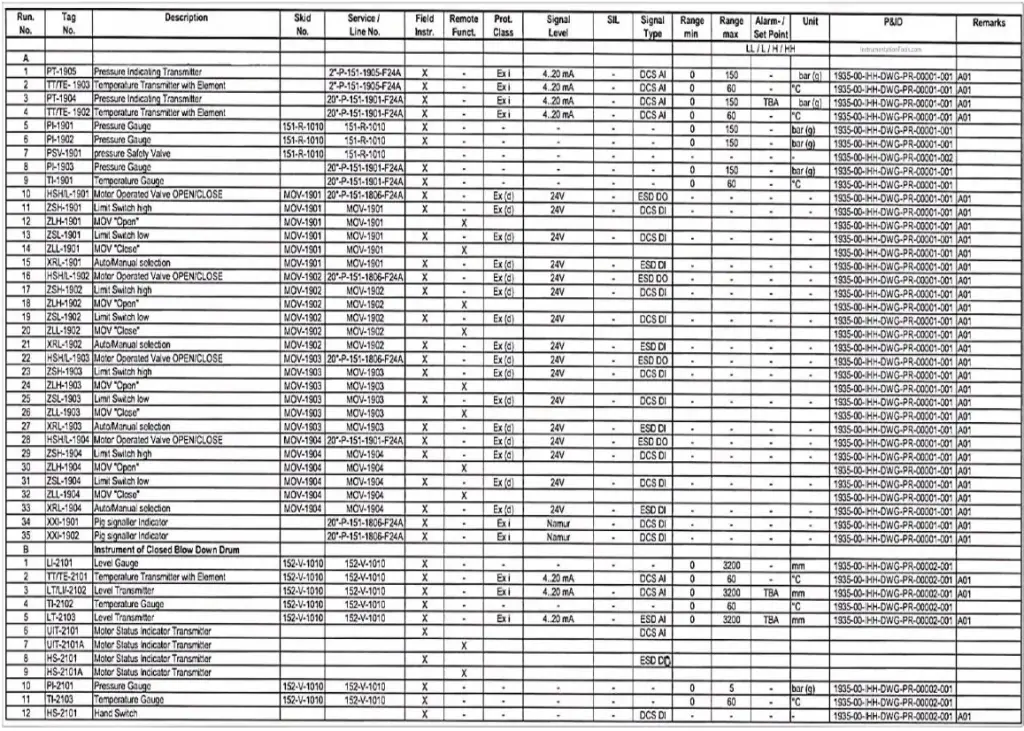
The I/O List is used for defining the type of signal inputs & outputs of the instruments used. The main function of I/O lists is to define the number & types of signals given to PLC / DCS. This is the basic document used to size PLC / DCS. The main data that must be included in an I/O List is as follows.
- Instrument Tag Number
- Service
- Signal Type
- Signal Level
- Instrument Range
- P&ID Number

4. Instrument Specification and Datasheet
Instrument specifications are one of the foundational deliverables in the instrumentation engineering domain. These documents define the technical requirements of each instrument in the system. Instruments used in the oil and gas industry typically include flowmeters, pressure transmitters, temperature sensors, control valves, gas detectors, and control panels.
Both P&ID & Process Data are required to prepare Instrument specification documents. It helps in specifying the precise requirement of the process for which the instrument is to be used. Purchasing an instrument is mainly dependent on instrument specification. The major data that must be included in the Instrument Specification Sheet is as follows.
- Tag Number
- Service
- Instrument Function
- Performance Criteria
- Environmental Conditions
- Power Supply Requirements
- Communication Protocols
- Material Specifications
- Type of Instrument
- Range
- Size
- Location
- Mounting
- Protection

Accurate and detailed specifications are necessary for selecting appropriate instruments and ensuring compliance with safety regulations, such as those set by the International Electrotechnical Commission (IEC), the American Petroleum Institute (API), or other international standards or specifications.
5. Instrument Loop Diagrams (ILD)
Instrument Loop Diagrams are the graphical representation of loops. ILDs are made using the help of P&ID, I/O List, & Cable Schedule. ILDs show the detailed flow of signal from the instrument to the control system cabinet. The major data that must be included in an ILD are:
- Components used the loop
- Location of the components
- Termination details
- Interlocks used
- Alarms
- Soft functions

These loop diagrams show how individual instruments connect to control systems, including wiring, sensors, and controllers.
6. Instrument Hook-up Diagrams
Instrument Hook-up Diagrams are the graphical representation of the method of connecting instruments to the process lines, equipment, tanks, vessels, etc. The main data that must be included in a hook-up drawing are.
- Physical mounting of the instrument in the field
- Various items used for mounting the instruments
- Size & material of various items used
- List of Tag Numbers for which the Hook-up is applicable

7. Instrument Cable Schedule
A cable schedule is a document that contains the list of instrument cables. Each cable should have a precise number according to the numbering scheme. It is the most important document used for cable laying purposes in project engineering The main data included in the Cable Schedule is as follows.
- Cable Number
- Cable Connectivity
- Type of Cable
- Length of Cable
- Size of Cable

8. Instrument Logic Diagrams
The major function of the Instrument Logic Diagram is to determine the operation of a given component or system as the various input signals change. The most common use of a Logic Diagram is to provide a simplified functional representation of an electrical circuit.
It is easier and faster to figure out how output functions and responds to various input signals by representing a circuit using logic symbols than using the electrical schematic with its complex relays and contacts.

9. Cause & Effect Diagrams
The Instrument Cause & Effect Document is a tabular chart of the functions of various instruments. This document indicates the cause as an instrument signal in one condition and its effects on other instruments connected in the loop as per the logic.

10. Field Instrument Layout
Instrumentation layout plans define where and how instruments will be physically positioned within the facility. These deliverables are critical for ensuring that instruments are accessible for maintenance, calibrated correctly, and located in safe zones. Layouts are especially significant in the oil and gas industry due to the high-risk environments involved.
Field instrument placement plans consider the following factors:
- Accessibility: Instruments must be placed in locations that are easy to access for calibration, inspection, and repair.
- Safety Zones: Placement in hazardous areas requires adherence to explosive-proof and weather-proof guidelines. Instrument placement must avoid areas that could lead to failure or danger in the event of fire or explosion.
- Interference Avoidance: Instruments should be placed away from sources of vibration, excessive heat, or electromagnetic interference, which could affect measurement accuracy.
- Environmental Considerations: Temperature, humidity, corrosion, and exposure to harsh chemicals must all be considered when positioning field instruments.
Proper instrument placement ensures ease of operation and minimizes downtime during maintenance or upgrades.
11. Control System Architecture Documentation
This deliverable provides an in-depth overview of the architecture of the control systems, which are the central nervous system of the entire oil and gas facility. The control system architecture typically includes:
- Distributed Control System (DCS): A centralized control system that allows operators to monitor and control processes across various parts of the plant.
- Programmable Logic Controllers (PLC): Used for local control of equipment, PLCs are often deployed in safety-critical applications where real-time decision-making is needed.
- Human-Machine Interface (HMI): Provides operators with graphical interfaces to monitor system performance and intervene when necessary.
- Redundancy Plans: These are critical for ensuring continuous operation, especially in oil and gas facilities where downtime can result in significant financial losses or safety hazards.
- Communication Networks: Describes how devices will communicate with each other using protocols such as Ethernet, Modbus, or wireless technologies.
This documentation is vital for understanding how various systems will interact and ensuring the seamless operation of the entire plant.
12. Hazardous Area Classification and Equipment Certification
One of the critical deliverables in instrumentation engineering for the oil and gas industry is the classification of hazardous areas and the certification of equipment. The oil and gas industry often involves environments with explosive gases or vapors, particularly in offshore and underground drilling operations.
The deliverables in this category typically include:
- Hazardous Area Classification: This process involves analyzing the facility to determine the likelihood of the presence of flammable gases or vapors. Areas are classified into zones (Zone 0, Zone 1, Zone 2) depending on the likelihood and frequency of a hazardous atmosphere.
- Equipment Certification: Instruments and electrical equipment used in these zones must be certified to meet explosion-proof standards, such as IECEx or ATEX certifications, ensuring they are safe for use in hazardous conditions.
- Explosion Protection Methods: The design and implementation of protection techniques like intrinsic safety (Ex i), flameproof (Ex d), and increased safety (Ex e).
Proper hazardous area classification and equipment certification ensure the safety of the facility, its workers, and the surrounding environment. More details about Hazardous Area Classification is covered here: What is Hazardous Area Classification? Steps and Guides
13. Testing and Commissioning Plans
Before the instrumentation systems are fully integrated and operational, testing and commissioning are necessary to ensure everything is working as expected. These deliverables consist of:
- Factory Acceptance Test (FAT): This test is conducted at the manufacturer’s facility to ensure that the instruments meet the required specifications before shipping. Further details about FAT can be read from here: Factory Acceptance Test– What Is FAT, and How Does It Work?
- Site Acceptance Test (SAT): Once the equipment is installed on-site, it undergoes testing to verify that it operates correctly in the actual environment.
- Calibration Reports: Detailed reports on the calibration of each instrument, ensuring they meet accuracy and precision standards.
- Performance Testing: Testing under operating conditions to confirm the entire system’s functionality, including communication protocols, control logic, and emergency shutdown systems.
A comprehensive testing and commissioning plan is essential for identifying potential issues early, minimizing risks, and ensuring the system is safe, efficient, and compliant with regulatory standards.
14. As-Built Drawings and Documentation
As-built drawings are one of the final deliverables in the instrumentation engineering phase. These documents provide a detailed, up-to-date representation of the system as it has been installed, including any changes or deviations from the original design. They include:
- Revised P&IDs: Updated diagrams reflecting any changes during construction or installation.
- Instrument Datasheets: Finalized datasheets with actual specifications of the installed instruments.
- Loop Diagrams: Updated to reflect the actual wiring and instrument configurations used during installation.
As-built drawings are essential for future maintenance, troubleshooting, and potential upgrades, serving as a historical record of the project.
Some other deliverables generated by Instrumentation Engineers are:
- Safety Instrumented System (SIS) Design: Includes the design of fail-safe systems, emergency shutdown (ESD) systems, and safety integrity levels (SIL) to protect against hazards and ensure personnel and equipment safety.
- PSV Sizing Calculation
- Control Valve Sizing Calculation
- Instrument Location Plan
- Junction Box grouping and Location Plan
- Cable Tray Layout
- Preparation of Material Requisition for Instrument Items
- Technical Bid Evaluation or Technical Bid Analysis
- Fire Alarm & CCTV Layout
- Fire Alarm Block Diagram
- CCTV Block Diagram
- Instrument – Electrical Interface Drawing
- Instrument – Piping Interface Drawing
- Instrument Earthing Philosophy Drawing
- Instrument Design Basis/Philosophy
- Pipeline Leak Detection Philosophy
- Metering Philosophy and Specification
- Telecomms Philosophy
- Control and Safety System Topology Diagram
- Telecoms Block Diagram
- EDS Philosophy
- Telecommunication System Functional Specifications
- Integrated Control & Safety System (ICSS) Specification
- Package Equipment Specification
- Control Panel Specification
- Control Room Layout Drawing
- Overall Telecommunication System Block Diagram
- Bulk Instrument MTO
- Technical Requisition for LLI’s
- Control Narratives & Sequence Descriptions
- Intrinsic Safety Calculations
- Instrument Air Consumption Calculations
- Electrical Power Consumption Calculations
- Equipment Room Layout Drawings
- Instrument Location Drawings
- Cable/Tray Routing Drawings/Cable Block Diagrams/ Schedule
- F&G Detector Layout Drawings
- Interconnection/Termination Drawings
- Instrument Installation Drawings
- Demolition Study/Drawings
- Telecommunication Design Basis / Philosophy / Systems Functional Specifications
If you know some other deliverables that I missed, kindly highlight in the comments section.
