
The concept of a free-body diagram is widely used in engineering and physics. A free-body diagram is a force diagram (a graphic, dematerialized, symbolic representation) that shows the relative magnitude and direction of all forces that act on an object in a specified situation. All forces and moments acting on the object are represented using two-dimensional or three-dimensional representation using the free body diagram or FBD concept. As the forces are vector quantities, FBD is also known as a vector diagram. In this article, we will explore more details about the free body diagram.
Purpose of the Free Body Diagram
The purpose of the free-body diagram is to deconstruct a given problem by using only the necessary information. Students can use this diagram as a reference for setting up the calculations to find unknown variables, for example, force directions, moments, or force magnitudes. Free-Body Diagram allows students to clearly visualize a particular problem in its entirety or closely analyze a particular portion of a more complex problem. So basically, FBD is a very useful aid to visualize and solve engineering problems. Note that, for solving a complex problem, a series of free-body diagrams may be required.
Drawing a Free-Body Diagram
In a Free-Body Diagram, the object is represented by its expression, usually a line, box, or dot. The force vectors that act upon the object are represented by a straight arrow while moments are represented by a curved arrow around their respective axis as shown in the image below where a force is acting at B and a moment acts around A. The force vector indicates the magnitude and direction of each force that is acting upon the object. The direction is normally indicated by degrees from the vertical or the horizontal axis while the magnitude is indicated by the units of force. In the case of an unknown direction of a force or magnitude, the unknown value must be labeled.
In addition, it is common to indicate the various types of forces with letters and distinguish between common ones by using subscripts. In the example problem shown in Fig. 1, weight and tension are represented by W and T, and the normal force and force of friction are represented by Ffrict and Fnorm. There are no hard rules about how forces are labeled as long as their meaning is clear. Free-Body Diagrams should have a labeled coordinate system and must include all the given dimensions, such as length and angles. Generally, a xy-coordinate system is used; however, when dealing with a problem, that is, in three-dimensional space, an xyz-co-ordinate system is required. Coordinate systems can be placed according to the student’s discretion in order to simplify the solving process, so long as the students are following the right-hand rule.
Types of Forces for Free Body Diagram
In order to identify and label forces of a Free-Body Diagram, one must recognize the various types of forces that they will encounter and must know how these forces will interact with each other in order to calculate them.
Weight:
Any object with a mass is known as weight. It can be shown in pounds or Newton’s (N). If the weight is not given, it can be calculated in Newton (N) by multiplying the mass in kilograms (kg) with the Earth’s gravitational constant (9.8 m/s2).
Normal Force:
According to Newton’s Third Law, every action has an equal and opposite reaction. Due to this law, an object that rests on a surface, that is, an object that is not in free fall has a normal force acting in a perpendicular direction to the surface of the object on which it is resting. In the absence of any additional forces, the magnitude of the vertical component of the normal force is equal to the weight of the object.
Friction Force:
Friction force resists movement and always acts in the opposite direction of the movement or potential movement. It also acts parallel to the surface and is perpendicular to the normal force. The friction force is equal in magnitude to the force that provides the movement until and unless the opposing force exceeds the maximum friction force. The maximum friction force can be calculated by multiplying normal force by the surface coefficient of static friction.
Tension:
This force is the pulling force that is exerted on an object by a rope, chain, or cable. Tension force is continuous from one end to another. Because tension force is always continuous and a rope is flexible, pulleys can be utilized to redirect the rope and by extension, the tension force.
Applied Force:
The applied force is a force that is applied by a person or by some other object.
Free Body Diagram Examples
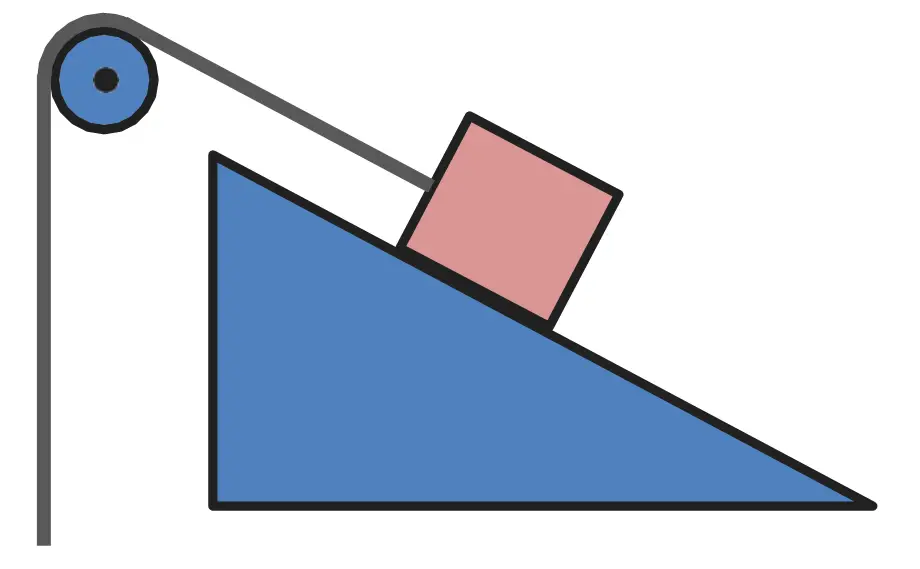
Now we will explain the FBD concept, using the following free body diagram example problem as shown in Fig. 1.
A 50 kg stationary box must be pulled up a 30-degree inclined by a pulley system. The coefficient of static friction between the box and that incline is 0.25. Assuming there is no friction in the pulley system, what force in Newton’s (N) must be applied to the rope in order to move the box up the incline?
How to draw free body diagram
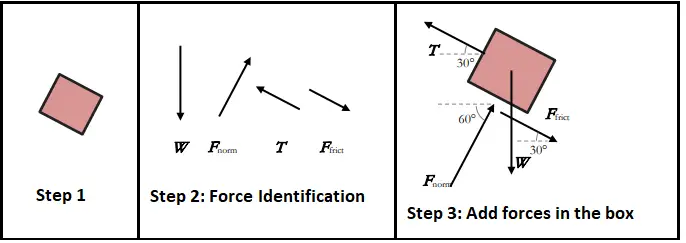
Step 1: Draw the object with no extra features.
Step 2: Identify the forces acting on the box. The box has mass, so it should also have weight, and a force acting downward. Because the stationary box is on a surface, there is a normal force that acts perpendicular to the surface. Further, attached to the box, there is a rope with tension applied. This tension force will act in the direction of the rope. Since the rope is directly attached to the box and in order to move it up the incline, there will be frictional force impeding movement. This force will then act in the opposite direction, down the incline.
Step 3: Add the forces to the image of the object and label the directions of forces in degrees from the vertical or horizontal axis as understood by the geometry in the example. Refer to Fig. 2 which shows the above 3 steps.
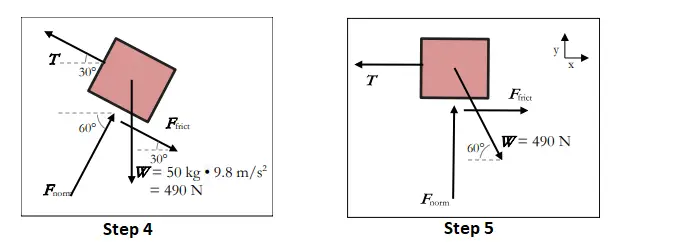
Step 4: Label all the known values. At this point, weight is known, that is mass (50 kg) multiplied by gravitational constant (9.8 m/s2). The FBD now contains all the given, important information.
Step 5: As a general rule, the Free-Body Diagram has to be oriented, so that the direction of movement is along with one of the principal axes. In this example, the entire diagram could be reoriented by rotating it to 30° counter-clockwise. This step results in the direction of movement that occurs along the x-axis, and this results in three of the four forces that also get oriented along the x or y-axis. Fig. 3 shows Steps 4 & Step 5.
Solving the Free-Body Diagram
To solve the problem, the force on the rope required to move the box up the incline should be found. This is called the tension force. Finding this force requires a system of equations. As there is currently one known variable, the weight, there are three unknown variables also; therefore, three equations are required. These equations establish a relationship between all of the forces and are required in order to solve for each force.
In this system of equations, the first one creates a relationship between normal force and frictional force. Since the box will not move until the tension force overcomes the frictional force, the maximum frictional force is needed. The maximum frictional force is equal to the normal force multiplied by the surface coefficient of static friction, that is 0.25, so the first equation will be: Fnorm * 0.25 = Ffrict
As the question refers to the minimum force required to begin moving the object, the system will be in static equilibrium before the time of movement. When a system that is in static equilibrium is concerned, there are two equations that are formed: ∑Fx=0 and ∑Fy=0, or, the sum of all the forces in the y and x-direction should be equal to zero.
When all forces in each direction are summed up, it is noted that any force that acts along either the x or y-axis (in this case tension, frictional and normal force) will only be present in that axis equation. However, weight does not act along one axis, and therefore, should be broken down into its component parts. This we get by using trigonometric functions. In this case, since the weight acts at a 60-degree angle, the vertical component will be Sin 60 degrees * W, and the horizontal component will be Cos 60 degrees * W.
To achieve the final two equations, the components of the various forces will be added together that act on each axis. Because of the direction of the positive x and y-axis chosen in the previous step, forces on the x-axis which is acting to the left will be negative, whereas forces that are acting to the right will be positive. Likewise, forces on the y-axis which is acting downwards will be negative, and forces that are acting upwards will be positive. Looking at the FBD, three forces will act in the x-direction: the tension force, the horizontal component of the weight, and the frictional force, and two forces will act in the y-direction: the vertical component of the weight and the normal force. This leads to the final equations as follows:
∑Fx= Ffrict+cos(60°)*W–T = 0 or Ffrict + cos(60°)*W=T
∑Fy= Fnorm– sin(60°)*W = 0 or Fnorm= sin(60°)*W
Now that the system of equations has been found, the unknown variables can be found by using known information, such that the weight is 490 Newton. Then Equations are combined in order to solve the tension. Fnorm=sin (60°)*490 N = 424.4 N
424.4 N*0.25 =Ffrict = 106.1 N
106.1 N+cos(60°)*490=T = 351.1 N
With tension force found, the answer to the problem is 351.1 N, that is, this amount of force should be applied to the rope in order to move the box up the incline.
In a similar way, most physics or engineering problems can be simplified, visualized, and solved by drawing a free-body diagram of the problem. If there is more than one object then a free-body diagram of each object can be generated.
I would like to know more about structural engineering