
What is a Process Flow Diagram?
A Process Flow Diagram (PFD) is a simplified diagram that shows the process flow of a manufacturing process in proper sequence. This diagram should consist of every essential detail like main equipment, Heat, Material, & Energy Balance, tag number, chemical composition, etc.
Also popular as Process Flow Chart, a Process Flow Diagram (PFD) describes the relationships between major components at any chemical, process, or power plant. Process Flow Diagrams or PFDs are developed using a series of symbols and notations to convey information for a process. The concept of PFD or process flow diagram was first introduced to ASME by Frank Gilbreth, Sr. in the year 1921.
Purpose of PFD or Process Flow Diagram
The purpose of the process flow diagram is to define the design of the process. A PFD is a fundamental representation of a process that schematically shows the conversion of the raw materials to the final products. Also, PFD is a basic document of a project as it is required by the project design team during the developmental stages of a project. At these stages, feasibility studies, and scope definition activities are undertaken before commencing detailed design. PFD is very closely associated with H & MB. For a project to proceed, they are used to decide if there are enough raw materials & utilities. The PFDs are documents that are used by plant-wide design groups and site management in a manufacturing organization. On completion of a PFD, detail engineering starts. Some engineering contractors or owners use a process flow diagram as a base for designing the instrumentation & control scheme. Other benefits that a process flow diagram serves are
- PFDs show the plant design basis indicating feedstock, product, and main stream flow rates and operating conditions.
- A PFD documents a process for training, quality control, and simpler understanding.
- It standardizes a process for optimal efficiency and repeatability.
- The scope of any process can easily be found in its PFD diagram.
- It provides an overall idea of the complete process without detailing much on the minute details.
- It helps to study the process in a simple way for better communication and brainstorming.
- PFDs serve as the input document for the creation of P&IDs.
- PFD diagram also provides information regarding the utility services that will be continuously used in a process.
Development of Process Flow Diagram
A PFD is most likely developed in multiple steps. The plant owner may develop a preliminary PFD, as a first step that sets down on paper a proposed process or a process change that is under consideration. But nowadays a PFD is generated by computerized simulator software using a library of indicating symbols like follows,
- Advanced simulation library,
- Aspen Hysys, Aspen Plus,
- CHEMCAD,
- CHEMPRO,
- DynoChem,
- DYNSIM,
- DWSIM,
- Flow Tran,
- PIPESIM,
- OLGA,
- Petro-SIM,
- ProMax,
- PRO/II, etc.
For a standard process, there are several licensors like UOP, Axens, Lummus, etc. & they are responsible for developing the PFD. Process flow diagrams of open art process units like CDU (Crude distillation unit), and VDU (vacuum distillation unit) can be found in the literature and encyclopedia of chemical technology. Some of them may be obsolete. After that, the PFD is reviewed by the engineering contractor’s process engineer & planning team before the release of the detailed design. So there is enough information in the PFD like material balance information, main equipment, etc. PFD undergoes several revisions based on the review, cost optimization, HAZOP study, opinion of the expert team, etc.
What are the basic information that a PFD contains?
The depth of information furnished in a process flow diagram may vary from organization to organization. However, in general, the following information is added in a PFD.
Design basis:
For batch process, indicate batch capacity & batch cycle time. For continuous process indicate design production rate.
Material balance:
Composition & quantity of material in process for each unit operation & each important pipeline. For batch process indicate equipment capacity & pipeline flow per batch basis. Continuous processes show flow rates in weight or volume units per hour.
Energy balance:
Indicate heat balance or heat transfer data for each unit operation.
Physical data:
Indicate operating pressure and temperature, specific gravity, molecular weight, viscosity, specific heat, and other important data.
Equipment information:
Represent all the unit operations involved in the process. Spare equipment, duplicate parallel lines, and bypass lines don’t need to show unless necessary. Arrange all the unit operations properly so that maximum simplicity can be achieved. Indicate the correct relative position so as to gravity flow, seal loop, and other requirements can be represented correctly. Represent the proper name, tag number, and capacity of each equipment item involved in the unit operations. Important features of the equipment like agitators, trays, and jacket coils are to be indicated in PFD.
Piping information:
Major process lines associated with the process are to be shown with proper directions. Other important piping items like sampling point, inline filter static mixture, etc as well as control valves to be shown in a process flow diagram. Show the major service or utility line that is essentially required for the process.
Instrument Information:
Show all the critical instruments which are involved in the control loop like the mass flow meter, temperature transmitter, etc. Along with the proper control scheme the instruments participated in the control scheme to be shown in the process flow diagram.
Size and Scale:
Use the standard scale ratio set by project standards for drawing the PFD. Generally, arrange the flow for trimming to 11” or 22” height. If an absolute scale is not used the process flow diagram should show the relative size and elevation of the components.
Drawing Instructions:
Use the standard symbol of the equipment, sketch, etc, set by the project standard. It should be represented in the legend sheet. Use the applicable data in a tabulated format and show it at the bottom of the process flow diagram for each unit operation and process line. Define the steam numbers of each process line shown in the process flow diagram whose operating condition should be represented in the process flow diagram. Indicate the proper arrow for showing the correct flow of the process so that the process flow diagram can be easily understood. Mention the process lines which carry the two-phase flow.
Flow summary:
Process flow data & conditions are provided on the process flow diagram (ref Table 5). As the process flow diagram is related closely to the material balance, mass flow units are normally used. Additionally, pressure & temperature conditions are provided as well. Flow summary is shown on the process flow diagram which contains all the necessary information. The below-tabulated format (Table-1) that contains the following information about the process should be represented in the process flow diagram.
| Essential information | Optional information |
| Stream number | Component Mole Fraction |
| Operating temperature | Component Mass Fraction |
| Operating pressure | Individual Component Flow rates |
| Vapor fraction | Volumetric Flow rates |
| Mass flow rate | Density, Viscosity, Heat Capacity, etc. |
| Molar flow rate | Stream Name |
| Individual component flow rate | K-Values |
| Flow Direction | Stream Enthalpy |
As already informed that PFD is not detailed drawings of the process. So It does not provide the following information, in general:
- Process control instruments
- Instrumentation of trip system
- Pipeline numbers with classes
- Shutoff, Isolation, and Minor bypass values
- Vents and drains
- Relief and safety valves
- Equipment dimensional information and requirement of spare equipment
- Code class information, etc
Symbols for Process Flow Diagram
The process flow diagram shall use symbols & letter designation to represent the equipment on the process flow diagram. It is not at all necessary to add more details to the equipment shown on a process flow diagram. For example, a heat exchanger can be represented as a simple line representation of the main process flow and heat transfer medium flow, without implying a particular type of exchange. For a process flow diagram, the only information required is that a piece of equipment transfers heat at that point of the process rather than showing specifically the mechanism for heat transfers.
Stream Identification
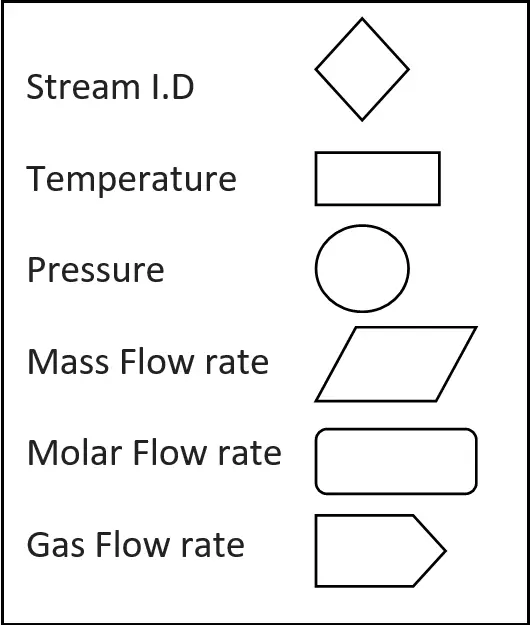
Conventions used for identifying process equipment
The below tables (Table 2) contain the symbolic letters which are generally used to identify the process equipment in a process flow diagram.
| Process Equipment | Letter |
| Compressor | C |
| Heat Exchanger | E |
| Fired Heater | H |
| Pump | P |
| Reactor | R |
| Tower | T |
| Storage Tank | TK |
| Vessel | V |
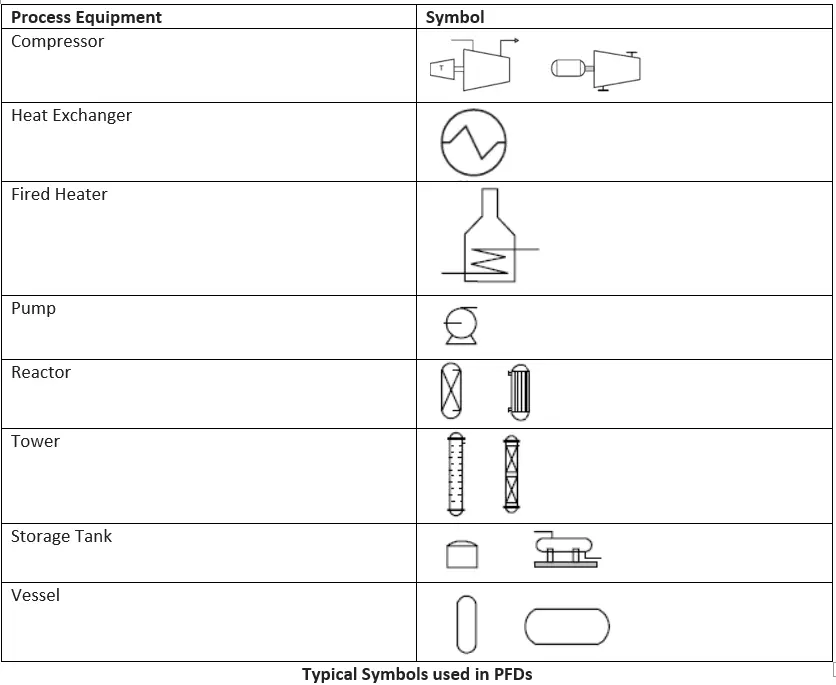
Process flow diagram Symbols for Equipment | PFD Equipment Symbols
The process flow diagram symbols for equipment are shown in Fig. 2 below.
Equipment Description for PFDs and PIDs
| Equipment Type |
| Description of Equipment |
| Towers |
| Size (height & diameter), Pressure, Temperature Number and Type of Trays Height and Type of Packing Material of Construction |
| Heat Exchanger |
| Type: Gas-Gas, Gas-Liquid, Liquid-Liquid, Condenser, vaporizer Process: Duty, Area, Temperature, Pressure for both streams No. of shell & Tube passes Material of Construction |
| Tanks/Vessel |
| Height, Diameter, Orientation, Pressure, Temperature, Material of Construction |
| Pumps |
| Flow, Discharge Pressure, Temperature, Driver type, Shaft Power, Material of Construction |
| Compressors |
| Actual Inlet Flow Rate, Pressure, Temperature, Driver type, Shaft Power, Material of Construction |
| Heaters |
| Type, Tube Pressure, Tube temperature, Duty, Fuel, Material of construction |
Example of Process Flow diagram
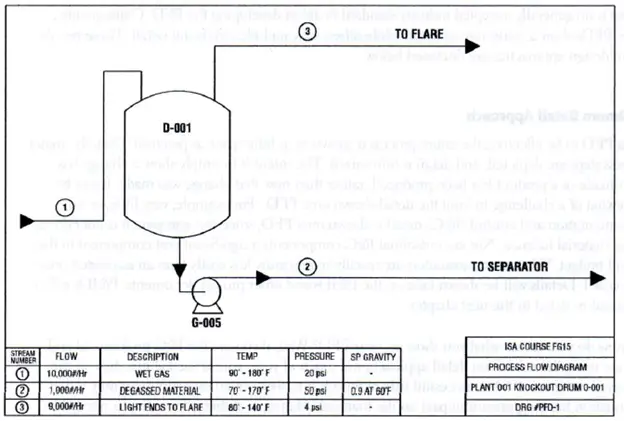
As per Fig-3, it is clearly showing that there is a flow in the process line, stream number (1) of 10000 lb/hr of wet gas with a temperature between 90 F and 180 F and a pressure of 20 Psi. The variation in temperature is caused by a process upset at the upstream of PFD. Note that, only a stream number, (1),(2),(3) identifies the pipeline. Not included is the line size, the material of construction, or the pressure rating (ANSI 150, ANSI 300, etc) for any of the piping shown on the PFD. Also, note that there is no symbol or data shown for the pump driver. Only the equipment number, G-005 identifies the pump. So it is very clear that the PFD represents the relationship between the main equipment of a process plant and at the same time, it does not show minute details like piping details and designations, etc.
Flow summary table:
| Stream Number | 1 | 2 | 3 | 4 | 5 | 6 | 7 | 8 |
| Temperature (ᵒC) | 25 | 59 | 25 | 225 | 41 | 600 | 41 | 38 |
| Pressure | 1.90 | 25.8 | 25.5 | 25.2 | 25.5 | 25.0 | 25.5 | 23.9 |
| Vapor Fraction | 0.0 | 0.0 | 1.0 | 1.0 | 1.0 | 1.0 | 1.0 | 1.0 |
| Mass Flow (ton/hr) | 10.0 | 13.2 | 0.82 | 20.5 | 6.41 | 20.5 | 0.36 | 9.2 |
| Molar Flow (Kmol/hr | 108.7 | 144.2 | 301.0 | 1204.4 | 758.8 | 1204.4 | 42.6 | 1100.8 |
| Component Mole Flow (Kmol/hr) | ||||||||
| Hydrogen | .0.0 | 0.0 | 286.0 | 735.4 | 449.4 | 735.4 | 25.2 | 651.9 |
| Methane | 0.0 | 0.0 | 15.0 | 317.3 | 302.2 | 317.3 | 16.95 | 438.3 |
| Benzene | 0.0 | 1.0 | 0.0 | 7.6 | 6.6 | 7.6 | 0.37 | 9.55 |
| Toluene | 108.7 | 143.2 | 0.0 | 144.0 | 0.7 | 144.0 | 0.04 | 1.05 |
Codes and Standards for Process Flow Diagrams
The following codes and standards can be used for developing process flow diagrams for the process industry.
- ISO 15519
- ISO 10628
- SAA AS 1109
- ISA 5.7
Are PFD and P&ID different?
Yes, both PFD and P&ID are two different process documents. P&ID provides more detailed information about the process steps. The main differences between a PFD and P&ID are provided here.
Online Courses on Process Flow Diagram
If you are planning to learn and read process flow diagrams and P&ID like a professional then check out the following course: How to Read P&ID, PFD & BFD used in Process Plant like Pro
Additionally, you can decide on the following course which is also very useful: Chemical/Process Engineering Drawings and Diagrams
Excellent information.