What is Fatigue Analysis?
Fatigue Analysis is the structural analysis of the failure tendency of systems when subjected to cyclical loads. Various software is available in the market to study fatigue behavior under cyclic loads. Fatigue is the progressive and localized structural damage that occurs when a material is subjected to cyclic loading. Continued cycling of high-stress concentrations may eventually cause a crack that propagates and results in leakages. This failure mechanism is called fatigue. Damage once done during the fatigue process is cumulative and normally unrecoverable.
Fatigue analysis is performed to find out the satisfactory performance level of a structural member under cyclic loading. It estimates the performance of the member under all three stages of fatigue failure. This means fatigue analysis will give data related to crack initiation, crack propagation, and finally failure probability for a specific material.
What is Fatigue in Piping and Structural Applications?
Fatigue for piping or structural applications can be defined as a failure methodology under a repeated or varying load situation. That load never reaches to such a level that it can cause failure of the member in a single application. However, the cumulative effect of each cycle can cause the failure by crack initiation and propagation. It’s a slow process and takes time for complete failure.
Objective of Fatigue Analysis
The aim of fatigue analysis of piping or structural systems is to assess and predict the potential for fatigue failure in these systems over time by calculating fatigue life and total damage. Fatigue analysis is essential for ensuring the structural integrity and reliability of various engineering components, including pipes, bridges, aircraft structures, and more.
Fatigue Analysis Methods
Fatigue analysis is performed using any of the two methods listed below:
- The Stress-Life (S-N) or S-N method of fatigue analysis or
- The local Strain or Strain-Life (e-N) method of fatigue analysis
The S-N method of fatigue analysis is highly popular in the piping industry. The Caesar II software uses the S-N curve as input and compares the piping stresses with it to provide a safe time limit before failure as fatigue analysis output. The S-N curves for each material are established by standards like ASME Sec VIII-Div 2.
On the other hand, the (e-N) method of fatigue analysis which is also known as the Crack Initiation method concerns itself only with the initiation of the first crack.
Types of Fatigue
Fatigue can be grouped into two classes;
- High cycle fatigue and
- Low cycle fatigue.
High Cycle Fatigue:
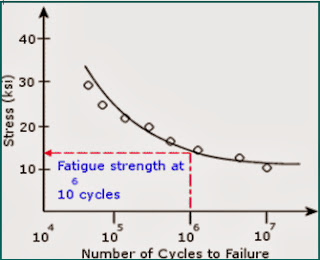
High-cycle fatigue involves little or no plastic action. Therefore, it is stress-governed. Normally, a fatigue curve (also called the S–N curve) is generated for every material by experimental tests that correlate applied stress with the number of cycles to cause failure. For high-cycle fatigue, the analysis is performed to determine the endurance limit, which is actually a stress level that can be applied an infinite number of times without showing any failure. As a general rule, the number of cycles 105 is considered a demarcation point for high and low cycle fatigue.
Low Cycle Fatigue:
The loading cycles applied in the piping design are normally very few in the order of a few thousand. This type of fatigue is identified as low-cycle fatigue. For low-cycle fatigue, the applied stress normally exceeds the yield strength of the material, which causes plastic instability in the specimen under test. But when strain is used as the controlled variable, the results in the low-cycle region are reliable as well as reproducible.
Reason for Fatigue Analysis of Piping System
A piping system may be subjected to cyclic loading from various sources. Hence, it is always better to perform fatigue analysis during the design stage. For the Piping system, Cyclic loading is primarily due to:
- Thermal Expansion & Contraction
- Vibration due to Occasional loading
- Pressure variation within the Piping system
- Motion wave.
- Due to Flow-induced Vibration
The fatigue process is divided into three stages: crack initiation from the continued cycling of high-stress concentrations, crack propagation to a critical size, and unstable rupture of the section.
Factors Affecting Fatigue Behavior
The factors which affect the fatigue behavior are listed below:
- Type and Nature of Loading.
- Size of Component and stress or strain Distribution.
- Surface finish and Directional Properties.
- Stress or Strain Concentration.
- Mean stress or Strain.
- Environmental Effects.
- Metallurgical Factors and Material Properties.
- Strain Rate and Frequency Effects.
Characteristics of Low Cycle Fatigue
- Characterized by high loads and a small number of cycles before failure.
- Here failure occurs only with stress levels in the plastic range, i.e. significant plastic strain occurs during each cycle.
- The stresses which cause fatigue failure in the piping are the peak stresses.
- In piping design, most of the loading cycles encountered would be of the low-cycle type
Characteristics of High Cycle Fatigue
- Characterized by a high number of cycles (Preferable N>10^4) with relatively low-stress levels, and the deformation is in the elastic range.
- This type of fatigue failure is used in the design of rotating machinery.
- This type of fatigue results from strain cycles in the elastic range.
- A stress level, endurance limit, may be applied for an infinite time without failure, is calculated.
Fatigue Analysis Theory and Failure Criteria
While preparing fatigue curves, the strains obtained in the tests are multiplied by one-half of the elastic modulus to obtain pseudo-stress amplitude. This pseudo-stress is directly compared with the stresses calculated on the assumption of the elastic behavior of piping. During piping stress analysis, stress called alternating stress (Salt) is used which is defined as one-half of the calculated peak stress. Fatigue failure can be prevented by ensuring that the number of load cycles (N) associated with specific alternating stress is less than the number allowed in the S–N curve or endurance curve. However, in practical service conditions, a piping system is subjected to alternating stresses of different magnitudes. These changes in magnitudes make the direct use of the fatigue curves inapplicable since the curves are based on constant stress amplitude. Fatigue tests of metallic materials and structures have provided the following main clues to the basic nature of fatigue:
- Fatigue failure, or cracking under repeated stress much lower than the ultimate tensile strength, is shown in most metals and alloys that exhibit some ductility in static tests. The magnitude of the applied alternating stress range is the controlling fatigue life parameter.
- Failure depends upon the number of repetitions of a given range of stress rather than the total time under load. The speed of loading is a factor of secondary importance, except at elevated temperatures.
- Some metals, including ferrous alloys, have a safe range of stress. Below this stress, called the “endurance limit or fatigue limit”, failure does not occur irrespective of the number of stress cycles.
- Notches, grooves, or other discontinuities of section greatly decrease the stress amplitude that can be sustained for a given number of cycles.
- The range of stress necessary to produce failure in a fixed number of cycles usually decreases as the mean tension stress of the loading cycle is increased.
- Examination of fatigue fracture shows evidence of microscopic deformation, even in the apparently brittle region of origin and propagates of the crack. The plastic deformation that accompanies a spreading fatigue crack is usually limited in the extent to regions very near the crack.
Therefore, to make fatigue curves applicable for piping, some alternate approach is necessary. One hypothesis asserts that the damage fraction of any stress level S is linearly proportional to the Ratio of the number of cycles of operation at the stress level to the total number of cycles that would produce failure at that stress level. This means that failure is predicted to occur if U≥1.0 where U= Usage factor = ∑(ni/Ni) for all stress levels Where ni= number of cycles operating at stress level i Ni= the number of cycles to failure at stress level i as per material fatigue curve.
Fatigue Analysis Methods
Fatigue Analysis considers the cumulative effect of all individual load cycles that may arise from temperature change, pressure fluctuation, wave motions, etc. If there are two or more types of stress cycles that produce significant stresses, their cumulative effect shall be evaluated as stipulated in Steps 1 through 6 below:
- Designate the specified number of times each type of stress cycle of types 1,2,3,…,n, will be repeated during the life of the component as n1, n2, n3,……., nn, respectively. In determining n1, n2, n3,……., nn, consideration shall be given to the superposition of cycles of various origins which produce the greatest total alternating stress range. For example, if one type of stress cycle produces 1000 cycles of a stress variation from zero to +60,000 psi and another type of stress cycle produces 10,000 cycles of a stress variation from zero to -50,000 psi, the two cycles to be considered are shown below:
- cycle type 1: n1=1000 and Salt1= (60000+50000)/2
- cycle type 2: n2=9000 and Salt2= (0+50000)/2
- For each type of stress cycle, determine the alternating stress intensity Salt, which for our application is one-half of the range between the expansion stress cycles (as shown above). These alternating stress intensities are designated as Salt1, Salt2, Saltn.
- On the applicable design fatigue curve find the permissible number of cycles for each Salt computed. These are designated as N1, N2, …….Nn.
- For each stress cycle calculate the usage factor U1, U2, …….Un where U1= n1/N1, U2= n2/N2,……..Un=nn/Nn.
- Calculate the cumulative usage factor U as U=U1+U2+…….+Un.
- The cumulative usage factor shall not exceed 1.0
Fatigue Analysis Softwares
Various software is available in the market with the potential for fatigue analysis. The most widely used fatigue analysis software are
- ANSYS
- ABAQUS
- CAESAR II
- Solidworks
Fatigue Analysis Steps
The majority of the established software mentioned above follows the same steps for performing fatigue analysis. The steps are
- Determining the fatigue loading details like the calculation of the number of cycles in the design life of the member
- Add this information to the software as input for fatigue analysis.
- Define the material fatigue data (like the S-N curve) from Codes/Standards
- Create the fatigue analysis load cases
- Run the Analysis and
- Process the output as relevant
Fatigue Curve
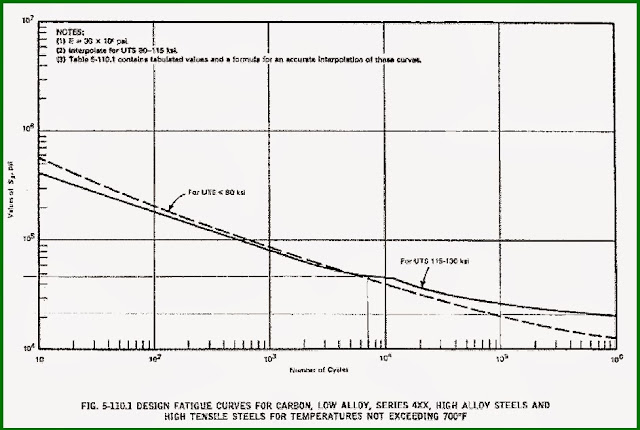
The plot of the Cyclic Stress capacity of a material is called the fatigue curve, also known as the S-N curve. ASME Section VIII Div 2 Provides a fatigue curve for various materials.
Fatigue design curves are generated from test data by applying large safety margins to the average property curve. While considering material fatigue in design, an additional safety margin is often applied against the cycles-to-failure at a given stress amplitude. As an example, if a component is cycled continuously over the same stress range (Any constant stress range), a design limit on allowable (permitted) cycles may correspond to the cycle life multiplied by a factor (safety margin) such as 0.8. This is the common safety margin employed in a vessel and piping design. For every material, a fatigue curve is normally generated by an experimental analysis that correlates the peak stress range with the number of cycles to failure.
The alternating stress Sa is defined as one-half of the calculated peak stress.
The fatigue failure may be prevented by ensuring that the number of load cycles N that the system experiences is lower than the number permitted for the alternating stress developed. The cumulative effect shall be evaluated in case there are two or more types of stress cycles that produce significant stresses. The material fatigue resistance at a given applied stress or strain range is a function of a number of factors, including material strength and ductility.
When to Perform Fatigue Analysis
Normally the fatigue analysis is performed for existing plants to evaluate the actual cause of any failure. For new plants, the analysis can be performed only if the project specification permits it to do so. Refer to project guidelines on the application requirement for fatigue analysis.
Input for Fatigue Analysis
Before starting the analysis be ready with the following data which will be required during the analysis:
- Fatigue Curve of the piping material
- Enough process data for finding the total number of cycles throughout the design life of the piping system.
Steps for Fatigue Analysis using Caesar II
Assigning the fatigue curve data to the Piping Material in use:
This is done on the Allowable auxiliary screen. Fatigue data may be entered directly or can be read from a text file by clicking the Fatigue Curves Button. Seven commonly used curves are available in \Caesar\System\*.Fat. (For Caesar versions 2012, 2013 &2014 you may not find it on a few computers, But these are available in earlier versions) Fatigue curves provide a series of S-N data that define the allowable stress with a given anticipated cycle and vice versa.
Defining the fatigue load cases:
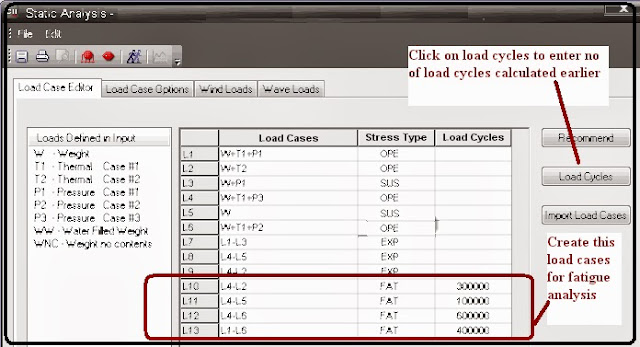
For this purpose, a new stress type, FAT, has been already defined in the Caesar II database. For every fatigue case, the number of cycles anticipated must also be entered in the appropriate space.
Calculation of the fatigue stresses:
Caesar II automatically does this calculation for us. The fatigue stresses, unless explicitly defined by the applicable code are the same as Caesar II calculated stress intensity (Max Stress Intensity), in order to conform to the requirement of ASME Section VIII, Division 2 Appendix 5.
Determination of the Fatigue stress allowable:
The allowable stresses for fatigue analysis are required to be interpolated logarithmically from the fatigue curve based on the number of cycles (throughout its life) designated in the fatigue load cases. The calculated stress is assumed to be a peak-to-peak cycle value (i.e., thermal expansion, settlement, pressure, etc.) for static load cases, so the allowable stress can be extracted directly from the fatigue curve. On the other hand for harmonic and dynamic load cases, the calculated stress is assumed to be a zero–to-peak cycle value (i.e., vibration, earthquake, etc.), so the extracted allowable needs to be divided by 2 prior to use in the comparison.
Determination of the allowable number of cycles:
The flip side of calculating the allowable fatigue stress for the designated number of cycles is the calculation of the allowable number of cycles for the calculated stress level. This is done by logarithmically interpolating the “Cycles” axis of the fatigue curve based on the calculated stress value. Since static stresses are assumed to be peak-to-peak cycle values, the allowable number of cycles is interpolated directly from the fatigue curve. Since harmonic and dynamic stresses are assumed to be zero-to-peak cyclic values, the allowable number of cycles is interpolated using twice the calculated stress value.
Reporting the analysis results:
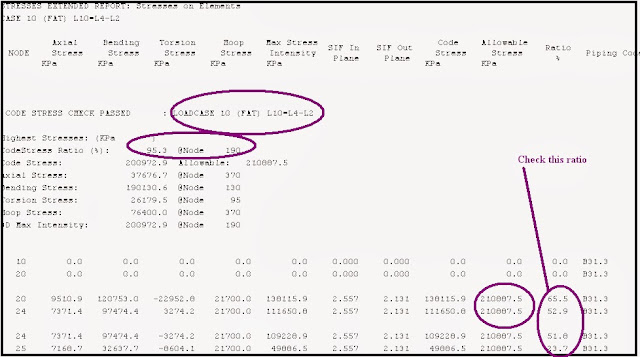
Caesar II provides two reports for viewing the results of load cases of stress type FAT; standard stress report and cumulative usage report. The first of these is the standard stress report for displaying the calculated fatigue stress and the fatigue allowable at each node. Stress reports could be generated individually for each load case and show whether any of the individual load cases in isolation would fail the system or not.
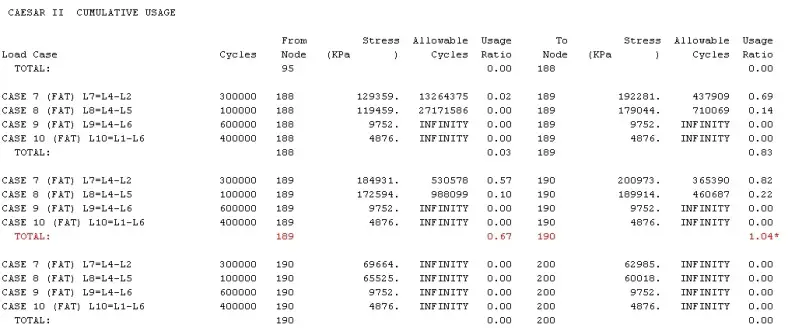
However, in situations where there is more than one cyclic load case potentially contributing to fatigue failure, the cumulative usage report is more appropriate. In order to generate this report, the user should select all of the FAT load cases that contribute to the overall system degradation (possible failure). The cumulative usage report lists for each node point the usage ratio (actual cycles divided by allowable cycles) and then sums (combines) these up for total cumulative Usage. A total value greater than 1.0 indicates a potential fatigue failure.
Fatigue Analysis Case Study
To perform fatigue analysis we need to calculate the thermal and pressure fluctuations the piping system will undergo in its design life. We have to calculate the worst possible cycles from preliminary data provided by the process/operation department. Let’s assume we received the following data from the process for a typical piping system.
- Operating cycle from ambient (40°C) to 425°C (400,000 cycles anticipated)
- Shutdown external temperature variation from ambient (40°C) to -20°C (300,000 cycles anticipated)
- Pressurization to 5.5 Bars (400,000 cycles anticipated)
- Pressure fluctuations of plus/minus 1.5 Bars from the 5.5 Bars (1,000,000 cycles anticipated)
Now, in order to do a proper fatigue analysis, these should be grouped in sets of load pairs which represent the worst-case combination of stress ranges between extreme states which we can do in the following way (Refer to the attached Figure, Fig. 3 for proper understanding):
The above figure (Fig. 3) explains the calculation of the worst-case cycle combination for fatigue analysis
- From -20°C, 0 Bars to 425°C, 7 Bars. 300,000 Cycles
- From 40°C, 0 Bars to 425°C, 7 Bars.: 100,000 Cycles
- From 425°C, 4 Bars to 425°C, 7 Bars: 600,000 Cycles
- From 425°C, 4 Bars to 425°C, 5.5 Bars: 400,000 Cycles
So in Caesar II, we can define the above data as follows (Refer Fig. 4): T1= 425°C; T2= -20°CP1= 5.5 Bar; P2= 4 Bar and P3= 7 Bar
Fig. 4 above shows the Caesar II spreadsheet explaining the input requirement Now go to the load case editor and define load cases as shown in Fig. 5 for fatigue analysis. Click on the load cycles button to input the number of cycles calculated above.
Fig. 5 above shows the fatigue analysis Load cases that have to be created for Fatigue Analysis Don’t forget that all load cases with stress type FAT (for fatigue) must have their expected number of Load Cycles specified. After the load cases are prepared, run the analysis to find out the results from the output processor. Part of the output results are provided in the attached figures for your reference (Fig. 4 and Fig. 5) The fatigue stress range (Maximum Stress Intensity as calculated in the Expansion stress case) may be checked against the fatigue curve allowable for each fatigue load case as shown in Fig 6.
However, this is not a true evaluation of the situation, because it is not a case of “either-or.” The piping system is subjected to all of these load cases throughout its expected design life, not just one of them. Therefore, we must review the Cumulative Usage report, which shows the total effect of all fatigue load cases (or any combination selected by the user) on the design life of the system. Refer to Fig 7 for an example.
This report lists for each load case the expected number of cycles, the allowable number of cycles (based on the calculated stress), and the Usage Ratio (actual cycles divided by allowable cycles). The Usage Ratios are then summed for all selected load cases; if this sum exceeds 1.0, the system has exceeded its fatigue capabilities.




In the example, you calculated the cycle type 2 and got n2 =9000 although it was state in example as n2=10000 , why ? Is it typing mistake ?
How can I reference your research?
You have no discussion on exceedances.