Recent Posts

What is a Pump Performance Curve? Types of Pump Performance Curves

The pump is a device that converts mechanical energy into hydraulic with the help of an external source, it may be centrifugal force through an electric motor. This centrifugal force is generated due to the rotation of the impeller above the suction port of the Pump, which helps in delivering fluid from one location to another via the discharge nozzle outlet. The pump type may be Centrifugal or Positive displacement, the mechanism will change accordingly.

Pump performance curves are very important graphs produced by pump manufacturers. They give information regarding how different parameters like NPSH required, efficiency, and power requirement will behave when the flow is changed. To select the right pump for a specific service, the engineer must know to read the pump performance curves. A pump performance curve is also known as a pump efficiency curve, pump selection curve, pump characteristic curve, or simply a pump curve.

What is a Pump Performance Curve?

The pump performance curve is the design analysis (or indication) of the pump and how it will operate with respect to the changes in operating parameters such as Pressure (Pressure Head is derived from pressure) & Flow rate.

The factors which are dependent upon the operating parameter are Pressure head, shut-off head, impeller diameter, efficiency, NPHSR, and Power Consumption. We will discuss these terms later in this article.

Generally, the pump performance curve is generated by the pump’s original equipment manufacturer such as Flowserve, Netzsch, etc.

Types of Pump Performance Curves

Generally, there are 5 types of curve representation available which are listed below:

  1. Head V/S Flow (H-Q Curve)
  2. NPSHR curve
  3. Efficiency Curve
  4. Power Consumption Curve
  5. Family Curve: It is the curve that includes different functional parameters (Shutoff head, efficiency, impeller diameter, NPSHR within a single curve)

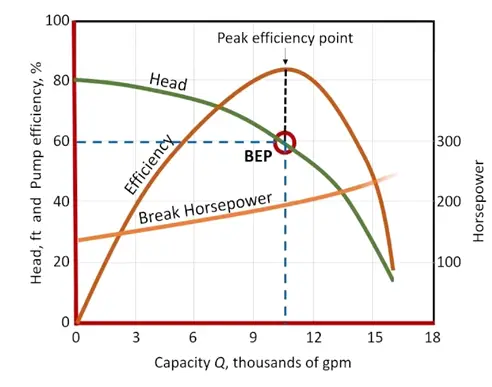
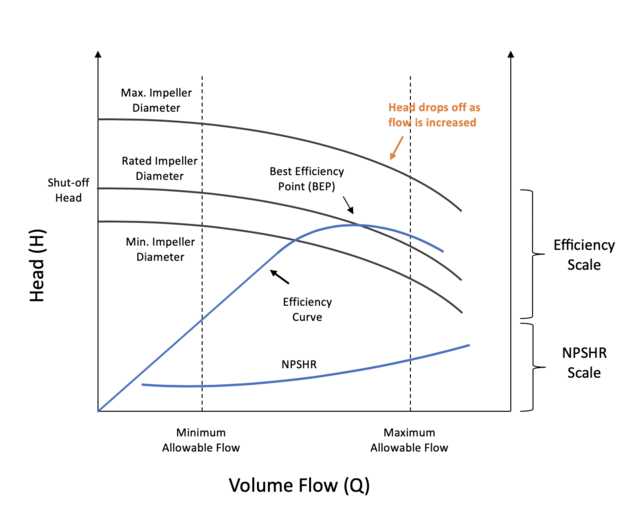
Please refer to the attached pump performance curves in Fig. 1 (first curve) and Fig. 2 (second curve) below. Fig. 2 is a typical example of a family curve.

Typical Pump Performance Curve
Fig. 1: Typical Pump Performance Curve

Cases for which the Pump Performance Curve is drawn or plotted

In general, there are three conditions for which pump performance curves are usually drawn. These are?

  1. Minimum flow: Minimum flow is the case in which deliverable flow through the pump is in operation.
  2. Rated Flow: Rated flow is the condition for which the pump is delivering a normal flow rate.
  3. Maximum Flow: ­Maximum flow rate is the expected rise in flow rate for future provision.

For Example, the Pump vendor requires the flow rate as Flow (Minimum/Rated/Maximum): 10 / 25 / 40* (m3/h) (Values indicated are typical only).

Example of a Family Curve
Fig. 2: Example of a Family Curve

Important Terms Involved with Pump Performance Curve

A basic understanding of the following terms is beneficial to understand the performance curve for any pump.

Flow: Flow is the quantity of liquid available for pumping application (i.e. amount of flow to be delivered through discharge of pump). It is represented on the X-axis of the Curve. Measurement of Unit is m3/h or GPM.

Differential Pressure Head: The head is the equivalent height of fluid energy due to pressure, velocity, or height above the datum (reference Point). The pressure head is generated because of pressure energy. This parameter is plotted over Y-Axis.

Differential pressure head can be calculated from the equation below:

∆P= rho* acceleration due to Gravity* ∆Height

Here

  • ∆P is the difference in pressure available at Suction & discharge.
  • ∆H is the difference in height of liquid at suction & discharge (also known as differential pressure head), and
  • rho is the density of the Fluid.

Curve Interpretation: The head is indicated on curve 1 with green color. The differential head is inversely proportional to the flow rate. Decreasing the value of the head from 60 to 40 meters over the Y-axis increases the flow on X-Axis from 9 to 12.5 thousand Gallons. Differential pressure head is measured in meters (m) units. Refers to the curve indicated above, as the deliverable or discharge flow required is increased pressure head gets reduced.

Shut off Head: Shut off head is the condition in which the pump gives the highest head. It is a condition in which the pump is designed as a discharge outlet of the Pump and is assumed as closed or blocked condition while in this condition flow corresponding to shut off head is Zero as indicated in the above curve. The shut-off head is also measured in meters (m).

Curve Interpretation: Shut-off head is attained in the case where the curve when the volumetric flow rate is zero. Shut off head is marked on Y-Axis over the curve.

NPSHR: NPSHR stands for Net positive suction head required means that a positive suction head requires to keep the pump safe from cavitation or boils off operation. NPSHR should be always greater than NPSHA (Net positive suction head available). The measuring unit for NPSHR is a meter (m).

Illustration: The basic purpose of NPSHR is to keep the pumping fluid pressure above the vapor pressure; vapor pressure is the state of matter in which phase is to be found in the gas phase (Vapour fraction is equal to 1). A positive suction head needs to be sufficiently more than required to maintain the fluid phase as real & causing the pump to any type of wear. 

Curve Interpretation: Refer to curve second, NPSHR is directly proportional to the flow rate, NPSHR increases as the volumetric flow rate is increased; the same is indicated in the curve.  

Efficiency: Efficiency is simply defined as the ratio of hydraulic power output to the shaft power input. In the description, hydraulic power is generated by the pump for developing flow rate & discharge pressure. In the shaft power case, this is Power delivered to the pump through an electric motor or external engine. The efficiency of the pump is usually indicated in (%) percentage.

Curve Interpretation: Refer to the indicated first curve as efficiency increases as the flow rate increases, thus reaching up to a specific Efficiency mark where efficiency is highest; this point is called the Best Efficiency Point. Moving on the curve either the left or right efficiency of the pump gets reduced and so on.

For Example: let’s assume a Car gives generally a 20 Km average but at a certain range of speed where the car produces the maximum average. Exactly is the same in the case of the Pump.

Power Consumption: The power consumption term ultimately relates to the efficiency in which shaft and hydraulic power are included.

Curve Interpretation: Refer to the first curve indicated with the orange line, Power consumption is in direct proportion with the flow rate. Power consumption rises as the pump flow increases. This power input’s main purpose is for the pump to produce a discharge flow rate that will be achieved by the external electric motor.

For Example, A 100 Watts bulb consumes high electricity rates than 10 Watts. Consumption is directly dependent on the Output.

Impeller Diameter: As indicated in the second curve, Affinity law defines flow as directly proportional to the Impeller diameter & Speed; the total head developed is directly proportional to the square of the Impeller diameter & Speed; power consumed through the pump is directly proportional to the cube of impeller diameter & speed. 

Curve Interpretation: Refer second curve Impeller diameter is indicated with three cases as in the curve, the Maximum case head achieved by the pump is maximum and thus higher the head lowers the volumetric flow rate. The same scenario is applicable in the Rated & minimum case of the impeller. The impeller diameter curve starts from the Y-Axis indicated in black color for all three cases (Max. / Rated / Min).

Image Credit: https://commons.m.wikimedia.org/wiki/File:Pump_Characteristic_curve.png

What are Lower Explosive Limits (LEL) and Upper Explosive Limits (UEL)

Explosive limits give the concentration range of a fuel (gas/vapor) that will cause an explosion or fire in the presence of an igniting source. There are two kinds of explosive limits that are widely used; LEL or Lower Explosive limits and UEL or Upper Explosive limits. Both LEL and UEL are represented by the percentage by volume of the gas in the air. In this article, we will learn the significance of Lower Explosive Limits (LEL) and Upper Explosive Limits (UEL).

What is Lower Explosive Limit or LEL?

The lower explosive limit or LEL of a vapor or gaseous substance is the lowest concentration of the gas in the air required to ignite/burn and explode in the presence of an ignition source. The lower explosive limit is also known as the lower flammable limit or LFL. To give an example, propane can explode once it reaches 2.1% of the air, by volume. So, the LEL of propane is 2.1%.

The LEL or lower explosive limit varies from one gas to another. In general, for most flammable gases LEL is less than 5% by volume. So, these flammable gases can create a high risk even with a very low concentration of the gas/vapor.

What is Upper Explosive Limit or UEL?

The highest concentration of a gas or vapor that will cause an explosion or burn in the air when ignited is defined as the Upper Explosive Limit (UEL). The other term for upper explosive limit is the Upper Flammable Limit or UFL. For example, propane will explode till the concentration does not exceed 9.5% in the air. Hence, the UEL of propane is 9.5%.

For a fire or explosion to take place, all three elements of the fire triangle must be present simultaneously. Those are fuel, an ignition source, and air/ oxygen. The ratio of fuel and oxygen must be above a certain minimum limit and below a maximum certain limit. This limiting minimum value is known as the Lower Explosive Limit and the limiting maximum value is known as the Upper Explosive Limit which varies with each flammable gas/vapor.

Significance of Lower Explosive Limit (LEL) and Upper Explosive Limit (UEL)

Information about the Lower Explosive Limits (LEL) and Upper Explosive Limits (UEL) of a gas/vapor is very important. Below the LEL level, the fuel and oxygen mixture is very lean and it will not cause burning or explosion. Again there will be a maximum concentration of gas (UEL) above which the fuel and air mixture will be very rich to cause an explosion. So, When the fuel and air mixture falls in between LEL and UEL limit, the condition is hazardous and it may cause fire/explosion in presence of an ignition source.

The above explanation can easily be simplified with an example of Methane gas. The Lower explosive limit of Methane is 5% volume in air and the Upper explosive limit is 17% volume in air. Hence, when the volume percentage of methane in an environment falls between 5% to 17%, the environmental condition is highly hazardous. The range of 5% to 17% is the explosive range for methane gas. When the volume percentage of methane is below 5% or above 17%, there will not be an explosion.

Note that even though the concentrations above the UEL are considered non-burning, they are still hazardous because if the concentration is lowered due to the introduction of fresh air, it will easily enter the explosive range.

Lower and Upper Explosive Limits of Various Fuels (Gases/Vapors)

The LEL and UEL values (percentage by volume) for some common gaseous fuels are provided in the following table.

Flammable Gas/VaporLower Explosive Limit (LEL %)Upper Explosive Limit (UEL %)Flammable Gas/VaporLower Explosive Limit (LEL %)Upper Explosive Limit (UEL %)
Acetone2.613Ethylene2.736
Acetylene2.5100Ethylene Oxide3.6100
Acrylonitrile317Gasoline1.27.1
Allene1.511.5Heptane1.16.7
Ammonia1528Hexane1.27.4
Benzene1.37.9Hydrogen475
1,3-Butadiene212Hydrogen Cyanide5.640
Butane1.88.4Hydrogen Sulfide444
n-Butanol1.712Isobutane1.88.4
1-Butene1.610Isobutylene1.89.6
Cis-2-Butene1.79.7Methane515
Trans-2-Butene1.79.7Methanol6.736
Butyl Acetate1.48Methylacetylene1.711.7
Carbon Monoxide12.574Methyl Bromide1015
Carbonyl Sulfide12293-Methyl-1-Butene1.59.1
Chlorotrifluoroethylene8.438.7Methyl Cellosolve2.520
Cumene0.96.5Methyl Chloride717.4
Cyanogen6.632Methyl Ethyl Ketone1.910
Cyclohexane1.37.8Methyl Mercaptan3.921.8
Cyclopropane2.410.4Methyl Vinyl Ether2.639
Deuterium4.975Monoethylamine3.514
Diborane0.888Monomethylamine4.920.7
Dichlorosilane4.198.8Pentane1.47.8
1,1-Difluoro-1-Chloroethane914.8Propane2.19.5
1,1-Difluoroethane5.117.1Propylene2.411
1,1-Difluoroethylene5.521.3Propylene Oxide2.837
Dimethylamine2.814.4Tetrafluoroethylene443
Dimethyl Ether3.427Toluene1.27.1
2,2-Dimethylpropane1.47.5Trichloroethylene1240
Ethane312.4Trimethylamine212
Ethanol3.319Vinyl Bromide914
Ethyl Acetate2.211Vinyl Chloride422
Ethyl Benzene16.7Vinyl Fluoride2.621.7
Ethyl Chloride3.815.4Xylene1.16.6
Table 1: LEL and UEL values of gases

LEL Sensors and Meters

The gas concentration must be closely monitored to safely work in hazardous closed spaces with flammable gases. Various LEL sensors or meters are used in industries that can give a warning signal. Infrared sensing elements of these LEL meters measure the lower explosive limits of various gases in an environment.

In general, when the gas concentration exceeds 20% of the gas LEL, the environment is considered unsafe. These LEL gas sensors provide a warning to the operators whenever the combustible gas in the environment exceeds 10%.

Modern LEL meters are highly sophisticated devices with microprocessors-based modular design and digital display. The most widely used LEL meter is the Wheatstone bridge type, which is proven to be effective for most environments. However, these types of LEL sensors have some limitations.

To overcome the drawbacks of LEL sensors, Photoionization Detectors (PIDs) with higher sensitivity sensors are developed which provide more accurate LEL measurements. PID can measure the concentration of inflammable gases and other toxic gases even when present at very low levels.

What are PPM and PPB?

PPM or “parts per million” is a dimensionless measure that provides the ratio of a substance in a mixture to the whole mixture. Sometimes LEL/UEL and toxicity of gases are provided in ppm. Similarly, PPB is parts per billion, which is also used for certain gases.

How to convert %LEL to PPM?

Both %LEL and PPM ratios indicate Volumes. While converting %LEL to PPM, 1% is considered equal to 10 thousand per million. Means,

  • 1% vol = 10,000 ppm.
  • 0.1% vol = 1,000 ppm
  • 0.01% vol = 100 ppm
  • 0.001% vol = 10 ppm
  • 0.0001% vol = 1 ppm

So, using the above values any %LEL can be easily converted into the corresponding PPM. Let’s take the example of hydrogen sulfide (H2S), which is both toxic and flammable gas. The LEL vol% for H2S is 4 (Refer to Table 1). That means,

  • 100% LEL = 4% vol = 40,000 ppm H2S
  • 50% LEL = 2% vol = 20,000 ppm H2S
  • 10% LEL = 0.4% vol = 4,000 ppm H2S

What is Process Engineering and What Do Process Engineers Do?

The term “process” can be defined simply as a way to make a product from raw materials. The process engineer’s job is to select process steps for product manufacturing and the required specifications. There will be several processes to make the same product. The best way to manufacture a product has not yet been discovered and it cannot be said that the product can be manufactured in one way only. Process engineers are facing alternative solutions to a production problem. 

This possibility arises from a combination of factors such as information, imagination, knowledge, and experience obtained from past processes. However, the economics of production is the key to finding the most optimized process. Therefore, innovation, Ideas, and cost-effectiveness are key elements of process engineering.

What is Process Engineering?

Process engineering is the understanding and application of the basic principles and laws of nature that enable humans to transform raw materials and energy into products useful to society on an industrial scale.  By taking advantage of natural forces such as pressure, temperature, concentration gradients, and the law of conservation of mass, process engineers can develop methods to synthesize and purify desired chemical products in large quantities. Process engineering deals with the design, operation, control, optimization, and enhancement of chemical, physical and biological processes.

What is the key difference between Chemical Engineering and Process Engineering?

For all practical purposes, it makes no difference, process engineers are often chemical engineers. 

A chemical engineer does not have to be a process engineer, but can be a project engineer or project manager.

A process engineer in the E&C business is a chemical engineer who practices chemical engineering, designs processes, and performs unit operations in the petroleum refining, petrochemical, food processing, biotechnology, pharmaceutical, oil and gas, and gas processing industries.

Skills required by a Process Engineer

A good process engineer should have the following capabilities:

  • Technical drawing interpretation
  • Good analytical and mathematical ability. 
  • Excellent written and verbal communication skills 
  • Ability to change existing practices. 
  • Strong attention to detail. 
  • Solid ability to identify, assess and solve problems. 
  • Good Software knowledge
  • Commercial awareness

What Does a Process Engineer Do?

Process engineers perform calculations, analyze results, and create designs within safety and control parameters to achieve the desired product. A process engineer’s job begins with a block diagram that consists of the major operations involved. As the design progresses, block diagrams are transformed into process flow diagrams showing key controls and required process parameters, and finally, detailed drawings called Piping and Instrumentation Diagrams (P&IDs). The P&ID represents all control layouts and piping layouts for the various unit operations involved in the process.

A unit operation is a piece of machinery that is also indicated by a P&ID along with details such as sizing, process data, and operating parameters. This P&ID will continue to serve as a guideline for developing process and functional specifications. In basic engineering, the process engineer plays a key role, in initiating and establishing the process flow based on the specifications received from the customer and working on the created design layout.

Some of the other responsibilities of a process engineer can be listed as follows:

  • Design and development of the complete process using simulation software packages.
  • Developing P&IDs, PFDs, Line Parameters, Equipment Sizing, Line Sizing, etc for further activities.
  • Facilitating HAZOP, HAZID requirements, etc
  • Performing regular tests of existing equipment.
  • Commissioning and decommissioning of a plant or part of a plant.
  • Monitoring and Maintaining equipment.
  • Designing new equipment.
  • Researching, pricing, and assisting in the equipment purchase of new equipment
  • Redesigning/Improving the flow of the process in the factory or plant
  • Overseeing processes to guarantee efficient performance of the line to maximize output with minimum defects in the production line.
  • Overseeing the operations of the plant
  • Overseeing the safety of employees
  • Writing, maintaining, and collecting required paperwork to show compliance with safety protocols
  • Assisting in budgeting.
  • Verifying every detail of the production process to improve efficiency and productivity and cut costs.

Click here to learn the deliverables that a process engineer produces during the design phase of an EPC project.

Process Engineering Jobs

Process engineers are required in various industries. They usually got an opportunity to work in permanent or contract jobs. The majority of their jobs are in large and small factories, plants, and manufacturing facilities. Some of the industries where process engineers get jobs are:

  • Oil and Gas Industries.
  • The refinery, Chemical, and Petrochemical facilities.
  • Private process safety companies
  • Nuclear plants
  • Insurance firms
  • Companies that inspect chemical refineries
  • Water treatment facilities
  • Chemical manufacturers
  • Steel Industries
  • Pharmaceutical companies
  • Biochemical and biopharmaceutical Industries
  • Process Licensing
  • Mining Industries
  • Food and beverage manufacturers
  • Finance companies that fund chemical manufacturers
  • Environment-friendly and recycling groups
  • Offshore Industries
  • Process safety industries
  • Dairy industries
  • Cosmetics Industry
  • Mineral processing

Salary of a Process Engineer

The salary of a process engineer varies based on the education, experience, and location of the work.

In India, the salary of a fresh process engineer varies in the range of 300,000 INR to 600,000 INR per year. A mid-range process engineer with 10 years of experience usually earns 1,200,000 INR to 2,000,000 INR per year.

In the USA, the salaries of process engineers range from $35,000 to $162,000 per year.

How do you become a better Process Engineer?

It is by Years of experience. More specifically, it’s more than the ability to do lightning-fast calculations and estimates in your head, a good process engineer looks at an object, compares it to known measurements, and translates that information into formulas. For example, you can estimate the height and number of floors of a distillation column by looking at the number of rungs one foot apart on the attached ladder. Little tricks like this are compiled from years of experience. 

What is a Heavy Hex Nut? Dimensions of Heavy Hex Nuts

We all know that nuts are manufactured in different forms like Square nuts, Hexagonal nuts, Ring nuts, cap nuts, cylindrical nuts, dome nuts, wing nuts, etc. Among all of these types of nuts, Hexagonal nuts or Hex nuts are one of the most widely used nuts. Hex nuts also come in different types like standard hex nuts and heavy hex nuts. In this article, we will learn about Heavy hex nuts and their dimensions.

What are Heavy Hex Nuts?

Heavy hex nuts are six-sided (hexagonal) internally threaded fasteners and larger versions of common/standard hex nuts. They are widely used for structural applications and because of this, heavy hex nuts are also known as structural nuts. Hex-heavy nuts are used for high-strength threaded fastening with large diameters. They are thicker and wider than standard hex nuts.

Similar to all other nuts, the heavy hex nuts are also used along with other fasteners mainly with a bolt to secure two or more materials together. To provide a long-lasting experience, heavy hex nuts are produced in zinc, plain, stainless steel, and galvanized finishes.

Paired with heavy hex bolts, these types of nuts are most common in construction and engineering applications. Hex-heavy nuts are available in various grades and selected based on the application.

Heavy Hex Nut Standards and Specifications

The most popular Heavy Hex nut standard is the ASME B18.2.2 which covers the complete general and dimensional data for the various types of inch series square and hex nuts. Widely used ASTM standards that cover the Heavey Hex Nuts are:

  • ASTM A194
  • ASTM A563

Heavy Hex Nut Dimensions

Heavy hex nut dimensions basically consist of three specific dimensions as listed below:

  • Nut thickness (T)
  • Width across flats (F), and
  • Width across corners (C)

Hex heavy nut thickness, T is the overall distance from the top of the nut to the bearing surface measured parallel to the nut axis. Nut thickness also includes the thickness of the washer plate if available.

Nut’s width across flats, F is the distance between two opposite sides of the heavy hex nut measured perpendicular to the nut axis. Similarly, width across corners is the distance between two opposite corners as shown in Fig. below.

Nomenclature for Heavy Hex Dimensions
Nomenclature for Heavy Hex Dimensions for Table-1

Heavy hex dimensions based on ASME B18.2.2 are given in table 1 below.

 Width Across Flats, F (inches)Width Across Flats, F (inches)Width Across Flats, F (inches)Width Across Corners, C (inches)Width Across Corners, C (inches)Thickness, T (inches)Thickness, T (inches)Thickness, T (inches)
SizeBasicMaxMinMaxMinBasicMaxMin
1/27/80.8750.8501.0100.96931/640.5040.464
5/81-1/161.0621.0311.2271.17539/640.6310.587
3/41-1/41.2501.2121.4431.38247/640.7580.710
7/81-7/161.4381.3941.6601.58955/640.8850.833
11-5/81.6251.5751.8761.79663/641.0120.956
1-1/81-13/161.8121.7562.0932.0021-7/641.1391.079
1-1/422.0001.9382.3092.2091-7/321.2511.187
1-3/82-3/162.1882.1192.5262.4161-11/321.3781.310
1-1/22-3/82.3752.3002.7422.6221-15/321.5051.433
1-5/82-9/162.5622.4812.9592.8281-19/321.6321.556
1-3/42-3/42.7502.6623.1753.0351-23/321.7591.679
1-7/82-15/162.9382.8443.3923.2421-27/321.8861.802
23-1/83.1253.0253.6083.4491-31/322.0131.925
2-1/43-1/23.5003.3884.0413.8622-13/642.2512.155
2-1/23-7/83.8753.7504.4744.2752-29/642.5052.401
2-3/44.2504.1124.9074.6882-45/642.7592.647
34-5/84.6254.4755.3405.1022-61/643.0132.893
3-1/455.0004.8385.7745.5153-3/163.2523.124
3-1/25-3/85.3755.2006.2075.9283-7/163.5063.370
3-3/45-3/45.7505.5626.6406.3413-11/163.7603.616
46-1/86.1255.9257.0736.7553-15/164.0143.862
Table 1: Heavy Hex Nut Dimensions

Standard Hex Nuts vs Heavy Hex Nuts

The shape of both Standard hex nuts and heavy hex nuts are the same. However, there are some differences between a heavy hex nut and a standard hex nut as listed below:

  • For the same nominal size, a finished hex nut or standard hex nut has a smaller width across the flats and corners than a heavy hex nut.
  • The thickness of a heavy hex nut is slightly more as compared to a standard hex nut of the same nominal size.
  • As heavy hex nuts are 1/8” larger across the flats than a standard hex nut for all sizes, Larger wrenches and sockets are required to install a heavy hex nut.
  • As can be seen in ASTM A563, heavy hex nuts have a higher proof load strength compared to standard hex nuts.

What is ASTM A105 Material? A105 vs A105N

ASTM A105 or ASME SA105 is a specification for forged carbon steel piping components suitable for ambient and high-temperature services. They cover various pipe fittings (Tee, elbow, coupling, etc) and components like flanges, valves, etc.

All A105 components are made by forging with a weight limitation of a maximum of 4540 Kg (10,000 lb). Larger forgings beyond 4540 Kg are covered under specification A266. ASTM A105 material finds wide application in the piping and pipeline industry and is suitable for a range of services within a range of -29 Deg C to +425 Deg C. This carbon steel specification does not cover tube sheets and hollow cylindrical forgings for pressure vessel shells

Properties of A105 Steel

Killed carbon steel materials are used for making A105 forged components. A105 materials have a Specific Gravity of 7.9 and a melting point of 2740 Deg F. They have very good machinability and weldability.

The chemical composition of A105 Steel consists of the following elements:

  • Carbon: ≤0.35 %
  • Manganese: 0.60-1.05 %
  • Phosphorus: ≤0.35 %
  • Sulfur: ≤0.40 %
  • Silicon: 0.10-0.35 %
  • Copper: ≤0.40 %
  • Nickel: ≤0.40 %
  • Chromium: ≤0.30 %
  • Molybdenum: ≤0.12 %
  • Vanadium: ≤0.08 %

Additionally, there are two other criteria for ASTM A105 material that must meet. Those are:

  • The sum of copper, nickel, chromium, molybdenum, and vanadium must be ≤ 1.00 %, and
  • The sum of chromium and molybdenum must be ≤ 0.32 %.

The mechanical properties of A105 steel forgings are as listed below:

  • Minimum Tensile Strength: 70,000 psi (485 MPa)
  • Minimum Yield Strength: 36,000 psi (250 MPa)
  • Minimum Reduction of area (0.2 % offset method or the 0.5 % extension-under-load method ): 30%
  • Maximum Hardness: HBW 197. The usual hardness range for ASTM A105 carbon steel forge material is 137 to 197 HBW.

The maximum Carbon Equivalent [CE= C + (Mn/6) + (Cr+Mo+V)/5 + (Ni+Cu)/15] for A105 steel material shall be limited to a maximum of 0.48

Difference between A105 and A105N

Many a time we find the letter N is attached to A105 steel material. So, a question automatically arises if A105 and A105N are the same or not. If different then what are the differences between A105 and A105N materials?

The base material for both the above are the same and is A105 and both have the same chemical composition. The letter N in ASTM A105N denotes a specific heat treatment type. In general, A105 does not have specific heat treatment requirements while A105N needs normalizing heat treatment. This heat treatment makes A105 and A105N materials different from each other. The main differences between A105N and A105 can be mentioned as follows:

Due to normalization treatment, A105N has a better mechanical properties than regular A105 steel. The strength of A105N is improved by the normalization heat treatment. Also, A105N provides better performance in low-temperature service. Because of this A105N is recommended for critical applications.

What is ASTM A106? Different Grades of ASTM A106 and their Differences

ASTM A106 is an international (American) specification of carbon steel pipe. ASTM A106 is a widely used standard specification for seamless carbon steel pipes used for high-temperature service. The specification covers pipes from NPS 1/8 (DN6)to NPS 48 (DN 1200). All pipes under ASTM A106 are suitable for bending, welding, and other forming operation. A106 is also known as SA106.

Grades of ASTM A106 Materials

Depending on the chemical composition (mainly Maximum Carbon percentage) of A106 material, there are three grades of ASTM A106 materials. They are:

  • A106 Grade A, having a maximum of 0.25% carbon.
  • A106 Grade B, having a maximum of 0.30% carbon, and
  • A106 Grade C, having a maximum of 0.35% carbon.

In the chemical composition of the different grades as mentioned above, the percentage range of manganese also varies slightly with respect to grade. A106 Grade A usually has 0.27 to 0.93% manganese while A106 Grade B and C generally have 0.29 to 1.06% Manganese. The maximum percentage of other elements like phosphorus, sulfur, silicon, copper, chromium, molybdenum, nickel, vanadium, etc are usually the same in all three grades of ASTM A106 carbon steel material. However, ASTM A106 provides a note of caution for these other elements saying the total combined percentage of all these other materials shall not exceed 1%.

As the maximum carbon percentage of different grades of A106 material varies in chemical composition, so vary their mechanical strengths. While A106-A has a minimum yield strength of 30 KSI (205 MPa) and A106-B has a minimum yield strength of 35 KSI (240 MPa), the other grade A106-C has the largest minimum yield strength of 40 KSI (275 MPa). In a similar way, the tensile strength also varies. Both tensile and yield strength increase when we move on from Grade A to Grade C but at the same time, the percentage elongation reduces.

Difference Between A106 Grade A, B, and C

The main difference between ASTM A106 Grade A, B, and C are their maximum carbon percentage in the chemical composition and corresponding change in mechanical properties like tensile and yield strength, elongation, etc as discussed above.

Properties of A106

In general, A106 pipes have the following properties:

Density: 7800 – 8000 kg/m3
Elastic Modulus: 190 GPa (27557 KSI) – 210GPa (30458 KSI)
Poisson’s Ratio: 0.27 – 0.30.

Mechanical Strength of A106 materials

Difference between ASTM A106 and ASTM A53

Both A106 and A53 are carbon steel pipes having wide applications. However, there are some differences between ASTM A106 and ASTM A53 pipe materials. The major differences that differentiate A106 pipe material from A53 pipes are provided in the following table:

ASTM A106ASTM A53
ASTM A106 pipes are seamless pipes.On the other hand, ASTM A53 pipes can be seamless or welded.
As per chemical analysis, A106 has silicon in its chemical composition.ASTM A53 pipes do not have silicon in their composition.
A106 pipes are generally costlier than A53 pipes.A53 pipes are usually cheaper than A106 pipes.
A106 pipes are usually used for high-temperature pressure applications.A53 pipes are usually not applied for high-temperature applications.
ASTM A106 vs ASTM A53

Difference between A106 and SA106

As a piping engineer, you must have heard that some are referring to the pipe as A106 while some are referring to SA106. So, a question always arises in our mind, “what is the difference between A106 and SA106 pipe materials”?

In general, there is no difference between pipe material A106 and SA106. The only difference is in their material standards. ASTM standard uses the callout A whereas the ASME standard uses the SA callout for pipe materials. The 2013 edition of the ASME II material chapter has confirmed that SA106 is consistent with ASTM A106. So basically, SA106 is a grade of American ASME while A106 is the grade of ASTM.

Is ASTM A106 killed carbon steel?

Yes, all three grades of ASTM A106 carbon steel seamless pipe materials are killed carbon steel.

Difference between A106-Gr. B and A333-Gr. 6

The main difference between A106 Gr B and A333 Gr 6 is that A333-6 is an LTCS material whereas A106-B is CS material. The lower temperature at which A106 Gr B pipe material can be subjected without impact testing and stress ratio checking is -28.90C (For thickness up to 12.7 mm as per table 323.2.2A of ASME B31.3 ) Whereas A333 Gr 6 material is already proven for use up to a temperature of -460C (Refer Table A-1M). Moreover, A106-B pipes are seamless whereas A333-6 pipes can be seamless or welded.