A spool valve is part of a hydraulic system that controls/regulates the fluid flow of the system. The valve is made up of cylindrical spools that rotate or slide to allow or stop the flow. Spool valves are designed in such a way that the leakage in the spool is small compared to the hydraulic system flow rate. Spools are basically valve components with seals mounted along their surface. Upon activation of the spool shifts cause the seals to travel along the bore which opens the ports to allow flow.
To move the flow around a circuit of pipes, spool valves slide forward and backward. A spool valve consists of two basic components: a cylindrical barrel that slides a spool or plunger. Glands provide the blocking of the ports. It can also be done by the full-diameter spool section, with the intervening waist sections providing interconnection of the port through the barrel. These help in multi-way and multi-positioning switching.
Spool valves are simple and low-cost devices. A proper surface finish is required for the barrel bore and spool to get proper sealing. It also needs close tolerance to provide practical minimum clearance. Glandless spool valves usually require a lapped fit between the spool and the body.
Types of Spool Valves
Spool valves can be categorized into two types. They are:
- Sliding spool valve and
- Rotary spool valve
Sliding Spool Valve:
Sliding spool valves along with their lands and grooves are cylindrical in cross-section. They are the most popular and widely used spool valves in the industry. The spool in a spool valve is grooved and slides in and out of position within the sleeve. This action alternately blocks and opens the fluid intake and outtake portals. Sliding spool valves find applications in pneumatic and hydraulic fluid power systems to control the flow and its direction. There are various modes by which sliding spools can operate. Those are:
- Manual operation,
- Mechanical actuation,
- Electrical means.
- The pneumatic operation, or
- Hydraulic or pilot control,
Rotary Spool Valves:
Rotary spool valves have spheres-like lands and grooves, in the form of holes. It consists of a fixed tubular sleeve, within which the core is rotating. Rotary spool valves work similarly to a revolving door, with each bend of the core functioning as a portal for hydraulic fluid to leave and enter the valve.
Extensively used in the machine tools industry, rotary spool valves got their name because of the rotational movement of the spool that opens or closed the fluid passage. They are usually manually operated and used in low-pressure applications with small flow rates.
Working of a Spool Valve
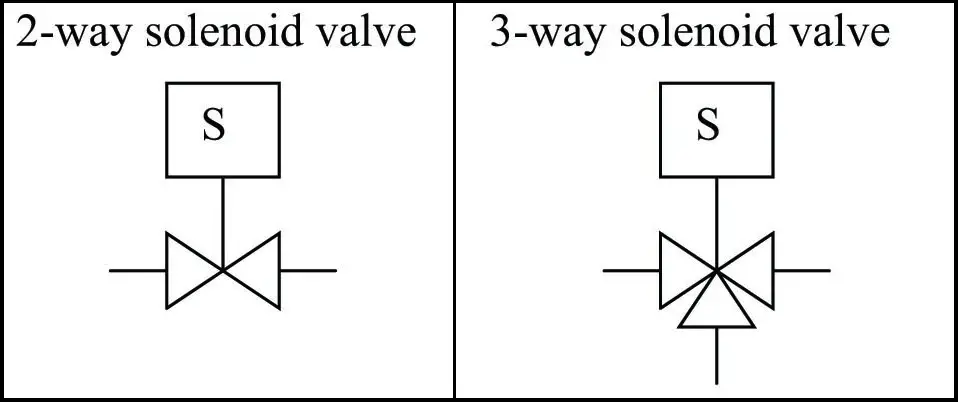
Spool valves are operated using either oil or air as the energy source. A spool valve has a cylinder inside a sealed outer case. Several chambers are drilled through the case from one side to the other to form ports. The spool moves within the sealed case. This movement ensures the opening and closing of these ports depending on the spool position. A spool valve can be operated using a button, lever, or by solenoid.
Spool valves are referred to using numbers such as 3/2, 4/2, 5/2, or 5/3, etc. Here, the first number indicates the number of ports and the second number informs the spool position. Spool valves are manufactured in a wide range of configurations.
Construction of Spool Valves
The cylindrical shaft known as the spool slides into a machined bore in the valve housing. The housing has inlet and outlet ports that connect the valve to the hydraulic system. The housing bore is divided by the lands of the spool into a series of separate chambers. The ports of the valve body lead into these chambers and the spool position determines the nature of interconnection between the ports.
Design Consideration of Spool Valves
As the spool valves work on a sliding principle, the design of these valves should follow the basics of sliding valves. Some of these design requirements to be controlled during the detail design stage of the spool valves are:
- The ports should be pressure-balanced such that there is no net axial pressure force on the spool.
- The diameter of the valve has suitable stiffness.
- The valve body or sleeve must be adequately rigid.
- To reduce friction forces, suitable material should be selected for sliding/rubbing parts.
- To avoid unbalanced radial forces annular flow should be symmetrical.
- Forces due to fluid momentum changes shall be minimized.
Configurations of Spool Valves
Mobile hydraulic systems widely use spool valves. The main reason is that in spool valves can easily adjust into two, three, or more positions to direct fluid between different combinations of inlet and outlet ports. With respect to their flow-directing states, there are four commonly applied neutral position configurations.
- Open center
- Closed-center
- Tandem center
- Float center
Advantages of a Spool Valve
Spool valves provide the following advantages:
- As it has the ability to select from high, low, and vacuum pressures, Spool valves can be used as selector valves.
- Spool Valves can be used to lock pressure downstream.
- The pressure entering the valve from any given port does not affect the spool movement.
- Less force is required to actuate as they are not affected by pressure.
- The fluid entering the valve from any working port does not affect spool movement.
Disadvantages of Spool Valve
The main disadvantages of a spool valve are:
- During actuation, all the ports are instantly opened to flow as the spool shifts.
- Due to the smaller internal surface area, the flow rate is lower.
- Product life is affected as the seals mounted on the pools are exposed to wear when traveling through the bore of the valve.
- As the spool valves are usually designed with metal-to-metal sliding fits, some fluids may bypass these seals.