Line sizing by the Process engineers is one of the most important and critical activities for any project. Line size is determined with proper sizing calculations considering various parameters.
Purpose of Line Sizing
The main purpose of line sizing are:
- The purpose of line sizing (for common, water-like liquids, gases, and applications) is to fill in appropriate data on P&IDs, datasheets, and line lists
- To determine pump head requirements
- To meet design process parameters such as flow, velocity & pressure.
This article will highlight a few of the factors which must have to be considered during line sizing.
Factors affecting Line sizing decisions
Line sizing decisions are affected by:
1. Economics:
Line sizing decisions have economic impacts, including:
- cost of pipe
- cost of pipe supports
- operating pressure/power requirements
Liquid lines that are sized smaller will require a larger system supply pressure (due to higher friction losses), and possibly a larger pump and pump motor, increasing equipment capital cost and operating costs. Another factor to consider is the cost of the piping (including valves). The difference in the capital cost of ½” to ¾” piping is negligible, however, the cost of 3” to 2” piping is significant.
Therefore, line sizing involves multiple economic factors, as well as other impacts.
2. Effect of Velocity/Turbulence in Pipeline Sizing:
- For incompressible fluids (air, steam, nitrogen, etc.), the only design concern is to avoid sonic velocity (typically above 100 ft/sec). Usually, pressure drop guidelines result in pipe size selections that avoid sonic velocity.
- In non-sanitary liquid applications, velocity and turbulence are typically not a concern, unless slurry flow is present.
- For sanitary, non-compressible applications (our most frequent designs), velocity and turbulence are concerns. It is necessary to maintain a fully turbulent flow to avoid stagnant areas in the piping system that can promote bacterial growth.
3. Pressure Drop Effects for Line Sizing:
- The effect of pressure drop within a system is closely correlated to the economics of the system. Smaller pipe sizes result in larger pressure drop requirements; economic considerations require a balance between pipe size and pumping/power requirements to overcome pressure losses through the system.
4. Impact of Line Holdup in Pipe Sizing:
- In the biopharma industry, certain product liquids may have exceedingly high value, and the holdup in piping systems may be a primary concern. In addition to minimizing the length of piping systems and the recovery capabilities (air blows, sloped piping, etc.) of the piping systems, a smaller line size may be chosen to further minimize the loss potential of the liquid held up in the line. This becomes the governing criterion for sizing even though the pressure drop exceeds the recommended range.
5. Space requirements for Line Sizing:
- Typically, space requirements are not a significant concern in the biopharma industry, since most pipe sizes are less than 6 inches in diameter. Space may be a concern when existing pipe racks are used, where areas are tightly piped, or with gravity drainage systems. Interaction with the piping designer will identify critical areas where space is a consideration.
6. Effect of Expansion Effects in Line Sizing:
- Header system sizing should consider the possibility of plant expansion. The incremental cost of a larger pipe size will avoid many headaches down the road if expansion is a distinct possibility.
- Sizing of sanitary water loops must critically consider expansion possibilities, since oversizing the supply loop may reduce the velocity below the acceptable values to maintain full turbulence. Often, the supply pump needs to be oversized as well as the header to account for expansion. This oversizing should only be done if expansion is a distinct probability.
7. Line Sizing based on Equipment Nozzle Connections:
Equipment nozzle connections for piping tie-ins are typically undersized when compared to the recommended pipe size. Be sure to perform the sizing calculation, select the appropriate pipe size, and, if required use reducers to connect the pipe to the equipment nozzle.
Steps in Line sizing procedures
Step 1 – Assume line size
Step 2 – Calculate velocity by
V = Q / (Flow Area)
Step 3 – Calculate the pressure drop by the proper method.
Step 4 – Check whether the calculated velocity & pressure drop falls within recommended ranges.
- If YES then select the line size
- If NO then selects a new line size and repeat steps 2 to 4.
Recommended velocities & max ΔP for Line Sizing:
| Sr. No | Types of Service | Velocity (m/sec) | Maximum ΔP Kg /cm2/100m |
| 1 | General Recommendation | 1.5 – 4.6 | 0.92 |
| 2 | Pump Suction | ||
| – Boiling Liquid | 0.6 – 1.8 | 0.115 | |
| – Non – Boiling Liquid | 1.2 – 2.4 | 0.23 | |
| 3 | Pump Discharge | ||
| – 0 – 57 m3 / hr | 1.8 – 2.4 | 1.38 | |
| – 57 – 159 m3 / hr | 2.4 – 3.0 | 0.92 | |
| – >159 m3 / hr | 3.0 – 4.6 | 0.46 | |
| 4 | Bottom Outlet | 1.2 – 1.8 | 0.14 |
| 5 | Reboiler Trapout | 0.3 – 1.2 | 0.035 |
| 6 | Liquid from Condenser | 0.9 – 1.8 | 0.11 |
| 7 | Liquid to chillers | 1.2 – 1.8 | |
| 8 | Refrigerant Lines | 0.6 – 1.2 | 0.09 |
| 9 | Gravity Lines | 0.2 – 0.5 | 0.04 |
| 10 | Drain Lines | 0.5 – 1.2 | |
| 11 | Boiler feed | 2.4 – 4.6 | |
| 12 | Liquid with suspended solids | 0.9 |
| Sr. No | Types of Service | Velocity (m/sec) | Maximum ΔP Kg /cm2/100m |
| 1 | General Recommendation for pressure level (Kg /cm2) | ||
| P > 35.1 | 0.46 | ||
| 14.1 < P < 35.1 | 0.35 | ||
| 10.5 < P < 14.1 | 0.14 | ||
| 3.5 < P < 10.5 | 0.069 | ||
| 0 < P < 3.5 | 0.034 | ||
| Subatmospheric | 0.023 | ||
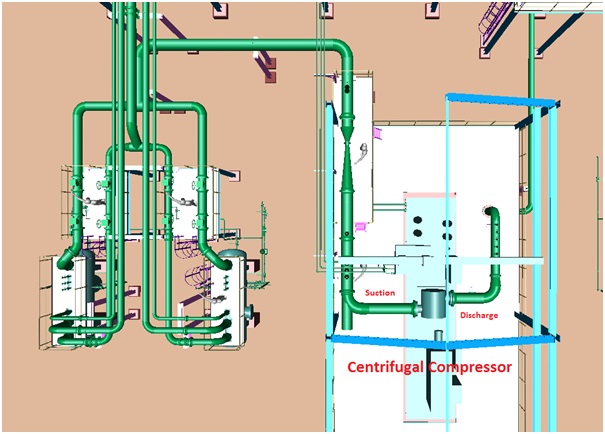
| 2 | Compressor piping Suction | 0.12 | |
| 3 | Compressor piping discharge | 0.23 | |
| 4 | Refrigerant suction lines | 4.6 – 11 | |
| 5 | Refrigerant discharge lines | 11 – 18 | |
| 6 | Tower Discharge | ||
| Pressure (P > 50 psia) | 12 – 18 | 0.046 – 0.12 | |
| Atmospheric | 18 – 30 | ||
| Vacuum (P < 10 psia) | 38 – 61 | 0.012 – 0.023 | |
| 7 | Saturated steam | 60 | |
| 8 | Superheated Steam | 75 | |
| 9 | Steam Pressure | ||
| P > 3.5 | 0.06 | ||
| 3.5 < P < 10.5 | 0.115 | ||
| 10.5 < P < 21 | 0.25 | ||
| P > 21 | 0.35 |
| Pressure | Friction Loss for Lines Less than 50 m (kPa/100m) | Friction Loss for Lines between 50 m and 150 m (kPa/100m) |
| 50mm Hg | 1.5 | 1.2 |
| 100mm Hg | 2.0 | 1.5 |
| 400mm Hg | 2.5 | 2 |
| 760mm Hg to 2.0 bar a | 3.0 | 2.5 |
| 2.0 to 5.0 bar a | 10 | 5 |
| 5.0 to 8.0 bar a | 12 | 7 |
| 8 to 12 bar a | 14 | 9 |
| 12 to 15 bar a | 16 | 10 |
| 15 to 35 bar a | 19 | 12 |
| Over 35 bar a | 25 | 14 |
Few more Resources for you…
Offshore Pipeline Design
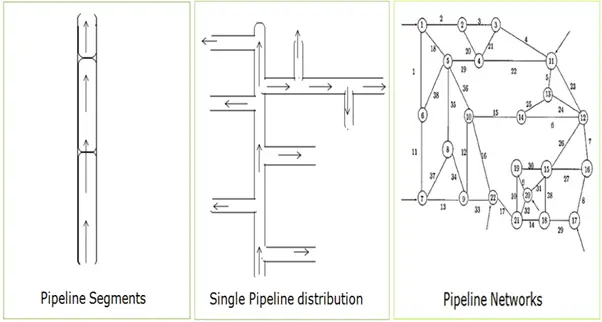
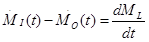
Hydraulic calculation in piping networks
Process Engineering Related articles
Mechanical Engineering Related Articles
Civil Engineering Related Articles
Instrumentation Engineering Related Articles
Pipeline Engineering Related Articles