Sidebooms and Pipelayers have widely used piping and pipeline heavy-construction equipment. They are ubiquitous while working in varying and challenging terrains. As a means of maneuvering pipeline components during assembly, Pipelayers and Side booms provide ease of installation and construction.
Sidebooms and Pipelayers are used to lift and move pipes to keep them in place, both for aboveground and underground installations. This construction equipment is a boon during the construction phases of oil and gas, water, sewer, chemical, petrochemical, power, and pharmaceutical projects.
Resembling somewhat like a crane, Sideboom and Pipelayers are mounted on caterpillar tracks. The main lifting mechanism consists of an articulated mast, a hoist system, and counterweights. They have a wide range of lifting capacities up to several thousand pounds. Side booms and pipelayers are designed to have a low center of gravity and various safety features similar to other lifting machinery like cranes.
Difference between Side boom and Pipelayer
Even though sometimes the terms side boom and pipelayers are used interchangeably, there are some differences as listed below:
Pipelayers differ from side booms because the vehicle platform, mast, crew cabin, and counterweights are mounted on Rotex gear. This allows the vehicle to pick and place materials at a 360° circumference.
Pipelayers do not have as high a capacity as side booms.
Pipelayers are more versatile in pipelaying environments as compared to side booms.
Sidebooms do not have a rotating platform, and the mast overhangs the left or right side of the vehicle.
Pipelaying operations can only occur on one side of the vehicle.
Pipelayers are usually not converted from a crane, but many side booms are modified into heavy-duty bulldozers.
Working of Side boom and Pipelayer
All conventional side booms and pipelayers work using a common principle. The left side of the tractor has a boom. Whereas the hoist works and counterweight are opposite to it. A pair of independently-operated drums control the boom angle and the hoist line. The load line is reeved over the tip of the boom and into a multiple-part hoist block.
The design of counterweights varies from one design or another. One design includes a static, unmoving counterweight made of individual sections. It allows the flexibility of adding or removing within machine design as needed.
The other design uses a hydraulically adjustable counterweight. The hydraulic counterweight operates based on the principle that lifting capacity is more when the counterweight was moved away from the load. These counterweights are swung down so that the pipelayer’s overall center of gravity is lowered which increases its stability. Also, the higher the counterweight’s pivot point, the better the machine’s ground clearance.
Characteristic Features of Side boom and Pipelayers
Sidebooms and pipelayers are manufactured in various configurations and lengths. It helps construction personnel choose the equipment depending on the pipe specification. The base machine is usually a crawler tractor that has counterweights on the other side to offset the weight being lifted.
The required power for the hydraulic systems is supplied by the diesel engines. For pipeline installation, side booms and pipelayers are deployed in teams. They are commonly called pipeline ‘spreads’, because of the fact that multiple work crews spread out to create an assembly line-like process.
For placing every pipe segment effectively, clear visibility is important. Hence, seats are so designed that the operator can have ample view of the pipe segment, boom, and the trench where the pipe is being placed.
There are various manufacturers that supply-side booms and pipelayers. The first machine of this kind was introduced by Caterpillar in 1955. Some other popular side booms and pipelayer manufacturers are Midwestern, Volvo, John Deere, Komatsu, Maats, Liebherr, etc. While working with this construction equipment and machinery, the safety and stability must be well thought off. Rollover protection systems are often used. All operators must be highly skilled at using the machine and all its functions of the machine.
Alarm management can be defined as the effective design, implementation, operation, and maintenance of alarms installed in any factory or workplace. A proper alert management system must be in place to alert the operator in case of any abnormal situation when the design limits are exceeded. Every plant must ensure alert management for
Safety of the Environment and personnel.
Equipment integrity, and
Product Quality control.
The control room operator must get clear and concise information from the alarm system. It enables them to recognize and respond to abnormal conditions that have arisen due to some reason. Alarm management is necessary for all operating environments. An operator can use a control system, such as a DCS, or a Programmable Logic Controller (PLC) to control abnormal situations.
Whenever any process deviates from the normal operating conditions, Alarms are triggered. The alarm management system should work on the occurrence of any type of abnormal operating situation. An abnormal situation can occur when a process in any operating plant is disturbed because of a deviation from its normal operating state, calling for human intervention.
If the abnormal situations are not diagnosed and controlled in time, they may create billions of dollars in impact on the economy. Hence, the alarm management system must aim at preventing, or at least minimizing physical and economic loss through operator intervention in response to the upset condition.
The processes and practices for determining, documenting, designing, monitoring, and maintaining alarm messages from process automation and safety systems are parts of an alarm management system.
Reason for Alarm Management
Safety and profitability are cornerstones of any sustainable operation. For safe and sustainable operations, the contribution of the Alarm and Alarm Management system is crucial.
Peter Drucker said “A well-managed plant is silent and boring,” but it actually takes a lot of work and effort to ensure this is the case.
In reality, alarm management does not always achieve this because they are improperly designed, poorly documented, changed without adequate review, or fail to provide enough information to the operator.
An effective alarm system is a key part of a safe and reliable process. Incorrectly designed and poorly functioning alarm systems can have serious consequences and lead to ineffective alarms; which in turn leads to alarm flooding, a high number of standing alarms, inadequate prioritization of alarms, and improper or no alarm action.
The advanced alarm management system is a combination of applications that help to make effective alarm systems, conforming to industry recommendations and standards such as the Engineering Equipment & Materials Users Association (EEMUA).
Advantages of Alarm Management System
Advanced alarm management system offers the following benefits:
Minimizes the number and impact of abnormal situations.
Identifies alarm system problems and performance, as well as operator workload.
Improves operator effectiveness, protecting plant uptime and safety, and reducing losses
Reduces time and effort to develop, deploy, and maintain alarm systems.
Production optimization/debottlenecking / increased throughput
Furthermore, ineffective alarm management leads to conditions such as
Untimely response to an alarm due to poor prioritization.
No alarm at all in spite of occurrences of the event.
No show of the alarm due to inhibited or disabled alarms.
Flood of alarms leading to a missing sequence.
A flood of alarms and missing events due to poor configuration
Ambiguous or missing instructions to the alarms are some of the harmful effects seen in the operations and many times, the alarm management systems are designed to address these issues.
Alarm Management Life Cycle and Rationalisation
A well-designed alarm management system needs to handle
Alarm overload,
More alarm than manageable,
Alarm floods,
Nuisance alarms,
Chattering alarms
Standing/stale alarms,
Redundant alarms,
Alarms that have no response, and
Alarms with the wrong priority
Key Steps for Effective Alarm Management System
There are seven key steps for Effective Alarm Management. They are
Step 1: Creation of an alarm philosophy and its implementation
A comprehensive design and guideline document must be prepared. It should define the plant standard and employ all lessons learned and best-practice alarm management methodologies.
Step 2: Alarm performance benchmarking
Determine the strengths and deficiencies of the alarm system by Analyzing it. Map out a practical effective solution to improve the alarm management system.
Step 3: Resolution of “Bad actor” alarms
The performance of the alarm system must be improved by eliminating bad actor alarms. Experience shows that more than half of the entire alarm load usually comes from relatively few alarms. Improvement must be done by making them work with minimum effort.
Step 4: Alarm documentation and rationalisation (D&R)
Each alarm in the system must comply with the adopted alarm philosophy and the principles of good alarm management.
Step 5: Alarm system audit and enforcement
The alarm system must be audited from time to time to ensure its proper working and security. It is very easy to alter the DCS alarm systems. So, methods must be devised to ensure that the alarm system does not drift from its rational state.
Step 6: Real-time alarm management
Advanced alarm management techniques are required to ensure that the function of the alarm system is properly achieved. The alarm should alert the operator in all operating scenarios. Some examples of such advanced technologies are
Alarm Shelving,
State-Based Alarming, and
Alarm Flood Suppression technologies.
Step 7: Control and maintain alarm system performance
To ensure that the gains that have been achieved from performing the steps above do not dwindle away over time, proper management of change and longer-term analysis and KPI monitoring is needed. The principle of “entropy” definitely applies to an alarm system.
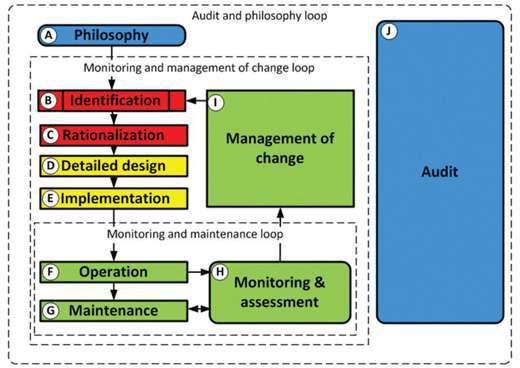
Actually, the alarm management concept mainly comes from standard ISA 18.2 – now also as international standard IEC 62682. One of the milestone activities of the standards is the alarm life cycle.
The following figure (Fig. 1) provides a detailed block diagram of Alarm Life cycle management.
We all are aware that the oil and gas industry is a key employment generator and a huge contributor to GDP. So for such critical industries, the operation must continue 24/7 without outages. To prevent outages, and shutdowns, and improve efficiency, the industry employs alarm systems for both onshore and offshore operations. These provide alerts to help locate the problem and resolve it immediately.
In general, oil and gas plants use alarm systems that aren’t the most efficient or effective. They usually generate distracting alarms that confuse operators without any clue to figure out the actual cause of an error. As operation means a loss of production, It directly affects revenue. Hence, the challenges of current alarm systems need mitigation. It will allow the oil and gas industry to resolve their maintenance outages, which in turn, will help the operators quickly assess the situation to get plant operations back to normal.
The local primary membrane stress (PL) is the stress generated due to a primary type load such as weight or pressure, but that is localized around a discontinuity such as a nozzle in a vessel.
According to ASME sec VIII div-2 part 5, A region of stress in a component is considered local if the distance over which the equivalent stress exceeds 1.1S does not extend in the meridional direction more than (Rt)0.5 where R and t are radius and thickness respectively.
Sometimes we face a big challenge to deal with these local stresses. Although they are very local, they are more than allowable. In these cases, the use of the elastic-plastic method instead of elastic analysis may help us to get rid of such stress categorizations.
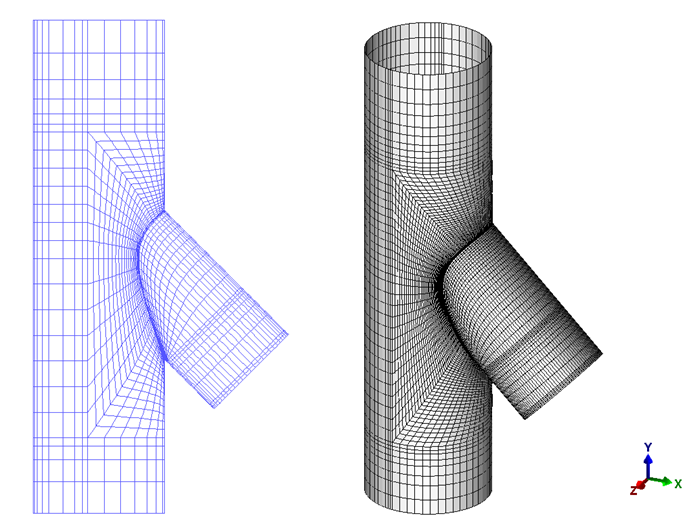
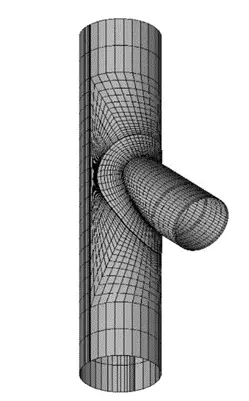
Let’s take a look at the below example to elaborate more. As you can see there is a simple unreinforced lateral connection with a header of 1524mm OD and 16.05mm as the thickness. The OD of the branch is 1219.2 mm with a thickness of 9.7mm.
Fig 1. Mesh Model of the unreinforced connection
A 0.36 MPa Internal Pressure is the only load that would be applied to this connection and it is assumed that the working temperature is 3100 C with allowable stress of 119 MPa. The material is assumed A106-B.
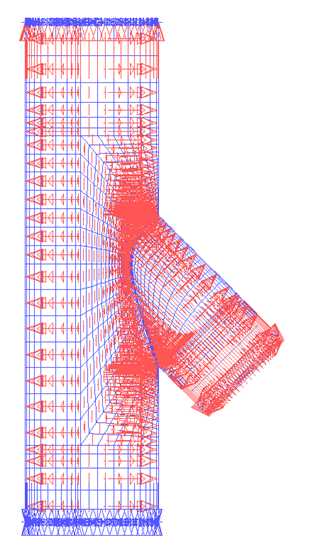
Shell elements and elastic methods have been used to perform FE analysis for this connection. The below figure shows the applied load and Boundary conditions.
Fig 2. Load and Boundary Conditions
Two Fixed BCs have been applied to both sides of the header. The internal pressure load has been shown with red arrows. In the below figure, the contour of PL has been shown.
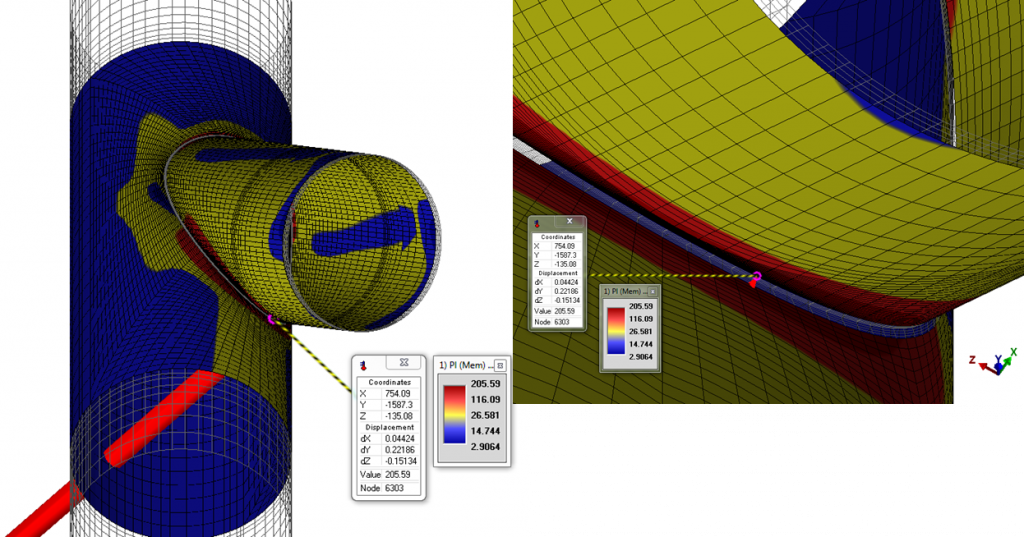
Fig 3. Stress contour of PL for the unreinforced connection
The maximum PL stress is about 205 MPa and has been located on the branch side next to the header weld, as it is expected.
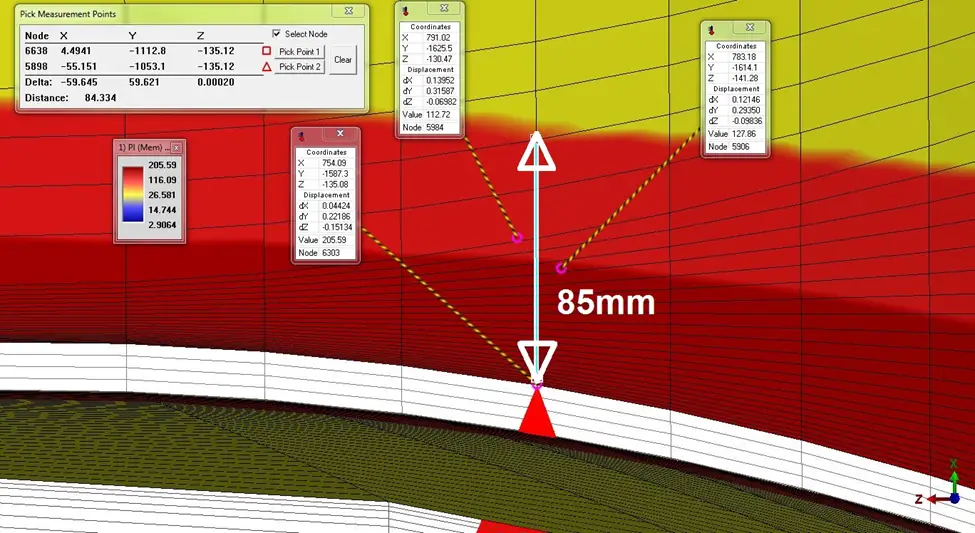
The below figure reveals how local the highest stresses are. However, they have exceeded the allowable which is 1.5S or 179 MPa.
Fig 4. Extent of the highest PL stresses for the unreinforced connection
As you can see the extent of the highest stress zone that exceeds 1.1S (131 MPa) is much lower than (Rt)0.5 of the branch.
It seems that a reinforcement pad will solve this problem. To investigate how it works, a new geometry that is the same as the previous one and also includes a reinforcement pad has been analyzed. The width and thickness of the pad are 500 mm and 16.05 mm respectively.
Fig 5. Mesh Model of the reinforced connection
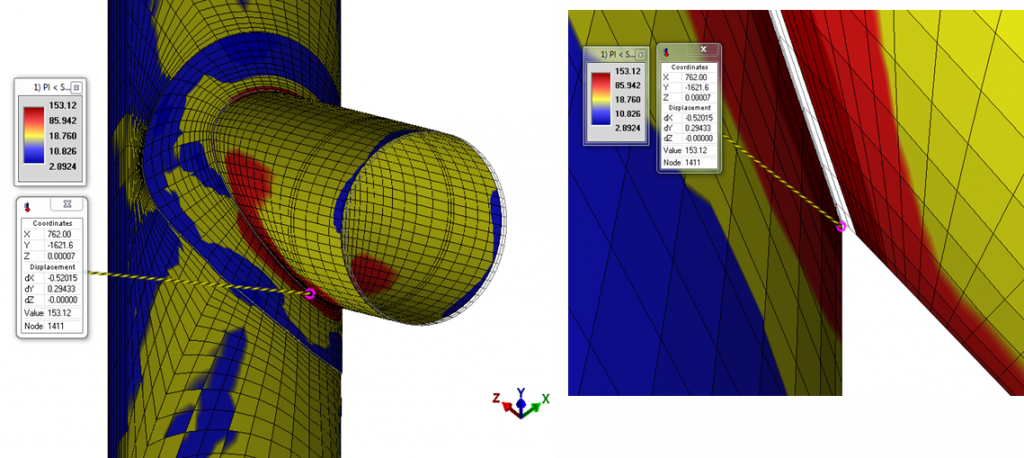
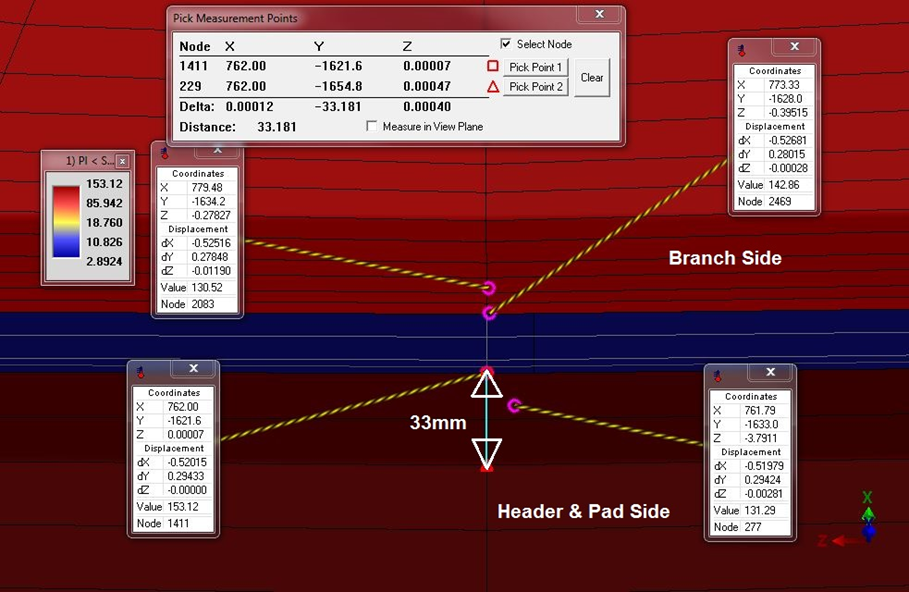
Now you can see the results. The maximum PL stress has changed to 153 MPa.
Fig 6. Stress contour of PL for the reinforced connection
Therefore, when a reinforcement pad is used the PL stress will be in the allowed range.
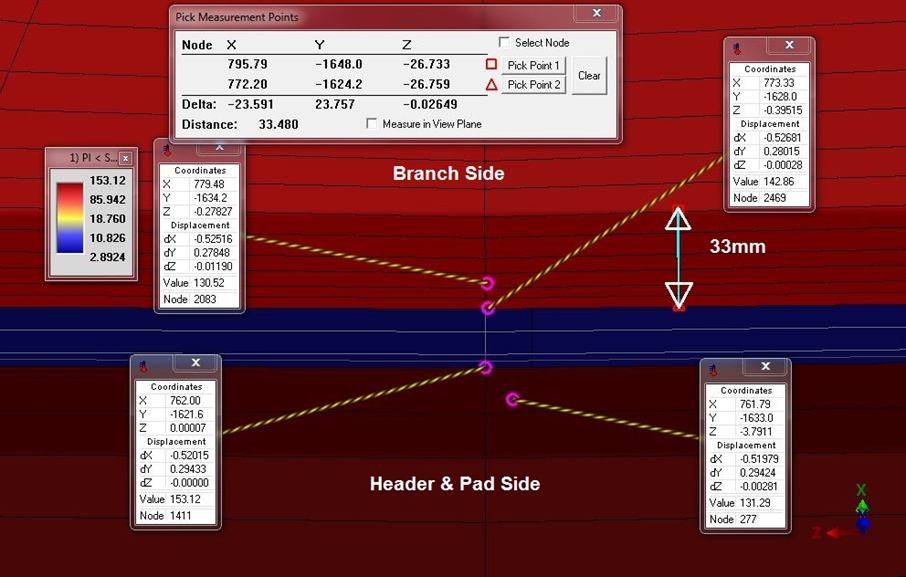
Also, the below figures show the extent of the highest PL stresses that is obviously much lower than (Rt)0.5 on both branch and header sides.
Fig 7. Extent of highest PL stresses for the reinforced connection
Another way to investigate this connection is the method that has been mentioned in para. 304.3.3 of the B31.3 code is about the reinforcement of welded branch connections. Following the mentioned rules reveals that using a pad reinforcement is not needed. Indeed, the basis for pressure design in this paragraph is to ensure excess area at discontinuity to account for material removed from the nozzle internally. This method does not attempt to discern stress at the discontinuity as well as some plasticity that may occur at design pressure.
But now the question is how we can justify this discrepancy between elastic FEA and the method mentioned in para. 304.3.3 of B31.3.
In the last step, an elastic-plastic method is used to study this connection without a reinforcement pad again. Diving into plastic analysis is not the intent of this short article. However, some of the assumptions are as follows.
The ASME sec VIII-2 part 3 multilinear stress-strain curve has been used. The material type is Ferritic steel while the amount of yield stress and tensile strength at working temperature is 177 MPa and 413.7 MPa respectively.
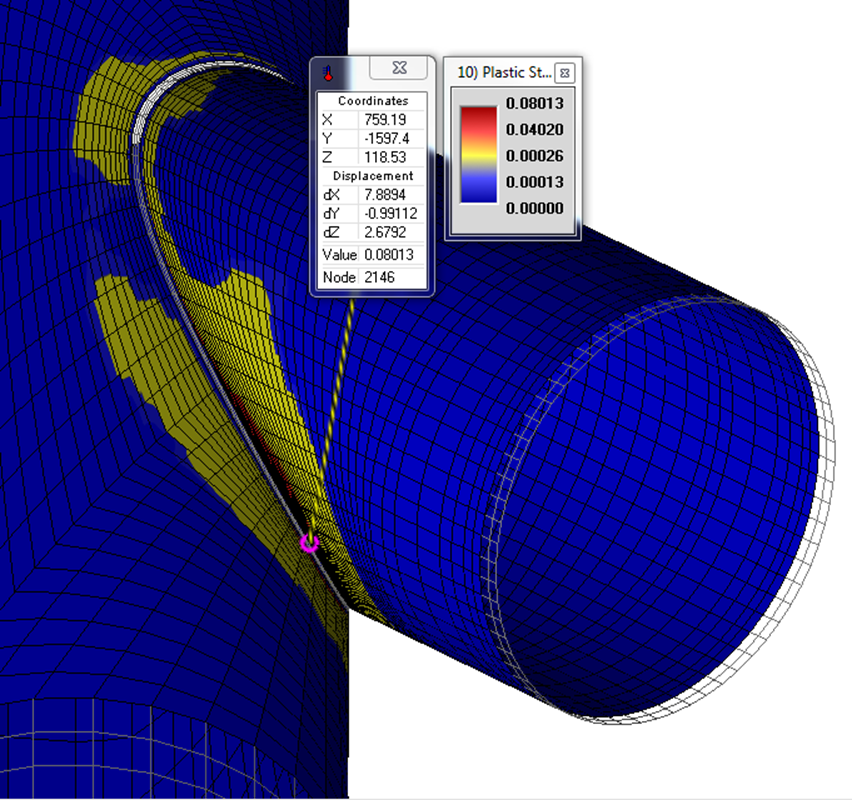
Since the convergence is achieved, there will be no collapse failure. Also, the amount of the highest plastic strain is about 0.08 and as it is expected has been located on the branch side. The below figure shows that the highest plastic strains are very local.
Fig 8. Plastic Strains distribution
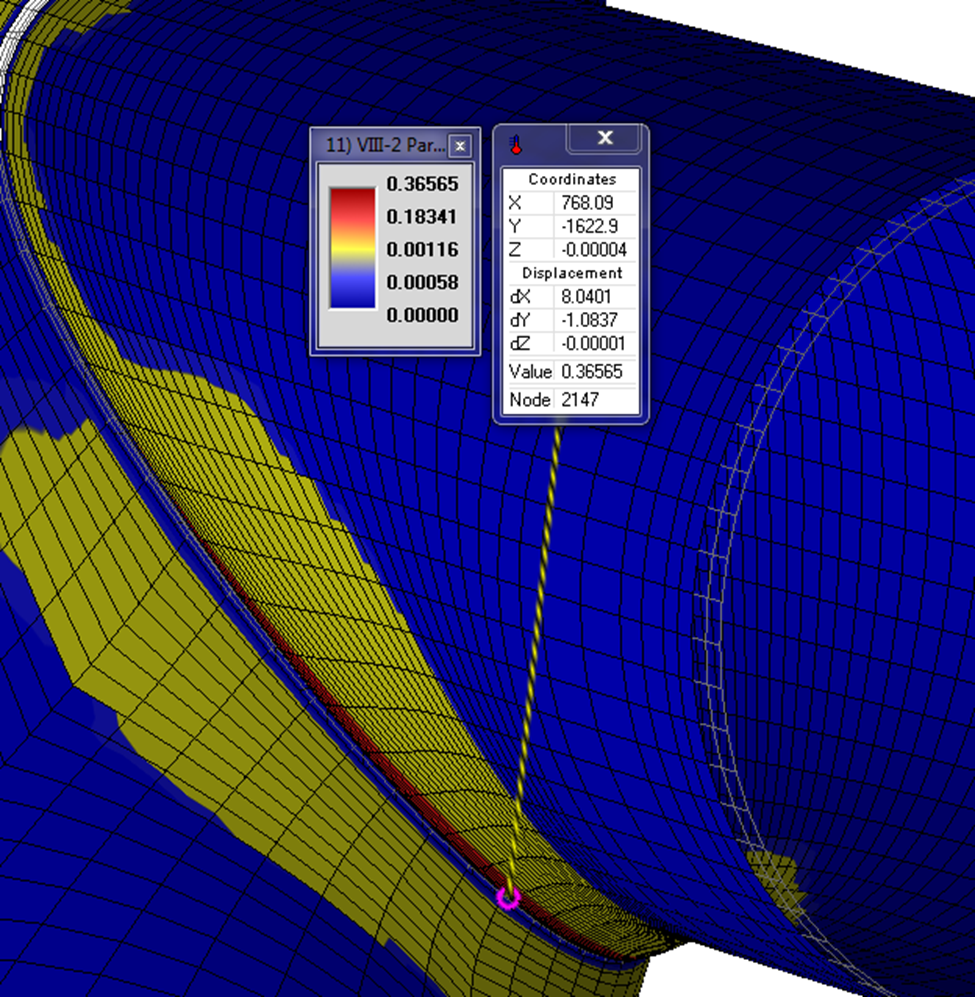
The local strain limit criteria (ASME VIII-2) have been also passed and the maximum ratio of plastic strain over limiting triaxial strain ɛpeq/ɛL is about 0.36 which is lower than 1.
Fig 9. ɛpeq/ɛL distribution
Finally, it is concluded that the connection is qualified using elastic-plastic analysis and no reinforcing pad is needed.
Indeed, with the help of a more advanced method, we were able to optimize the design and make sure that the plastic strains are local enough to qualify an unreinforced connection even for such a pressure load.
Waste-to-Energy: Overview of the Gasification Process
This article introduces the main existing technologies to carry out a conversion line of a waste stream into an energy-usable gas mixture (syngas). The syngas also serves as an intermediate point in the synthesis processes of various high-added-value products.
Introduction
Faced with the problems of climate change and global warming, research and development have focused on the use of biomass as an alternative to fossil fuels, among other energy sources. The wide availability of waste has been widely recognized for its potential to provide greater amounts of useful energy with less environmental impact than fossil fuels.
Waste can be converted into a commercial product through biological or thermochemical processes. The biological conversion of biomass continues to face challenges related to low efficiency and cost-effectiveness. In the case of thermochemical processes, combustion, pyrolysis, and gasification are the three main conversion methods.
Biomass is traditionally burned to provide heat and electricity in industrial processes. The net efficiency for electricity generation from its combustion is usually very low, not exceeding 50%. Biomass combustion is usually limited to 10% of the total feedstock due to, among other things, carbon lock-in in existing feed systems. Pyrolysis, on the other hand, converts biomass in the absence of oxygen. Limited uses and the difficulty of downstream processing have restricted the wide application of biomass pyrolysis technology.
Finally, gasification converts biomass by partial oxidation into a gaseous mixture, with small amounts of carbon and condensable compounds. It is considered one of the most efficient ways to convert the energy stored in biomass and is becoming one of the best alternatives for the reuse of solid waste.
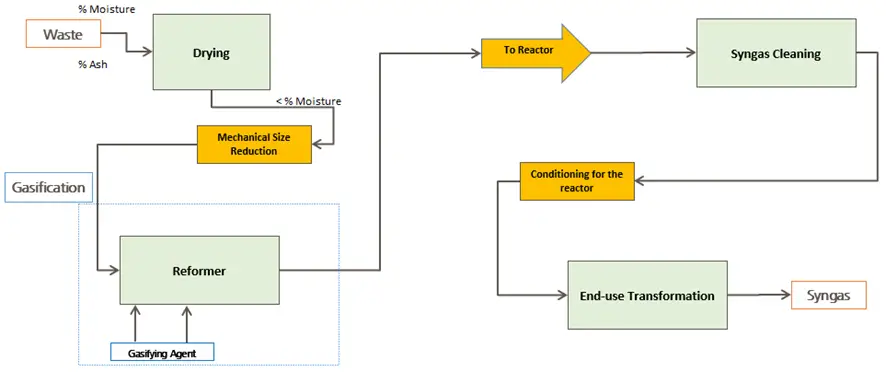
A process that is currently being developed in several parts of the world is the gasification of municipal solid waste (MSW), in which syngas is produced. After gasification, the syngas is treated to remove the main contaminants. Once the gas meets the necessary requirements, it can be used as an intermediate product for different processes, such as the production of SAF (sustainable aviation fuel) by Fischer Tropsch synthesis, or to produce DME and methanol, among other products of great interest on the world scene.
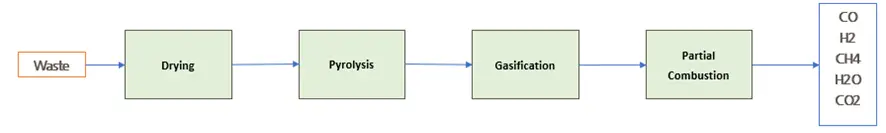
Fig. 1: Block diagram of the process of Syngas production from waste gasification
What is Gasification?
Gasification is a partial thermal oxidation resulting in a high proportion of gaseous products (CO2, H2O, CO, H2, and gaseous hydrocarbons), small amounts of carbon (solid product), ash, and condensable compounds (tars and oils).
Air, steam, oxygen, or a mixture of these is supplied to the reaction as the oxidizing agent. The gas produced can be standardized in quality and is easier and more versatile to use than the original biomass (e.g., it can be used to power gas engines and turbines or as a chemical feedstock to produce liquid fuels).
Gasification adds value to low-value feedstocks by converting them into marketable fuels and products.
Stages of Gasification
In conventional biomass treatment plants, energy is obtained through incineration or gasification.
The biomass gasification process allows energy to be obtained in the form of heat or electricity, using the syngas (synthesis gas) to drive the shaft of a turbine, or burning it as fuel to drive an engine. This process typically uses coal as a feedstock.
The chemistry of biomass gasification is quite complex. In general terms, the gasification process consists of the following stages (drying, pyrolysis, gasification, partial combustion):
Fig. 2: Gasification Stages
Gasification Reactor Design
Gasification reactor designs have been investigated for more than a century, resulting in the availability of several small and large-scale designs. They can be classified in several ways, although we will focus on classification by design.
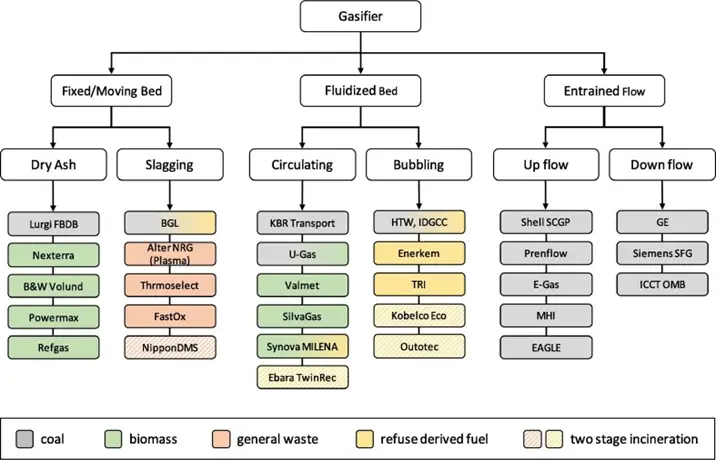
Depending on the configuration, gasifiers are classified into three main types: fixed-bed, fluidized-bed, and entrained-flow.
These gasifiers can be divided into the categories shown in the figure. Fixed-bed gasifiers are ideal for small-scale biomass feedstocks.
Fluidized-bed gasifiers can be used to process biomass and refuse-derived fuel (RDF) from pre-treated waste feedstocks, which must meet size, composition, and moisture content specifications.
Entrained flow gasifiers are commonly used for coal because they can be fed in direct gasification mode, which makes feeding the solid fuel at high pressures economical. Short residence time, high temperatures, high pressures, and large capacities are the characteristics of these gasifiers.
Fig. 3: Classification of gasifiers and commercially available technologies by feedstock type.
Challenges and Opportunities to Improve Gasification
The main problem arises in the heterogeneous nature of the reactor feed stream, the limited experience under commercial conditions, and the quality of the syngas obtained. Some of the problems related to waste heterogeneity are overcome by pre-treatment of the waste at the inlet of the gasifier. However, some energy is required and must be accounted for to make a proper balance.
The raw syngas may contain the following contaminants: tars, sulfur, nitrogen, and chlorine-containing gases (NH3, HCl, HCN, H2S, COS), fly ash, and particles containing K, Na, and traces of other elements that may influence catalyst performance.
Syngas or Synthesis Gas
Synthesis gas or “syngas” is a mixture composed of carbon monoxide, carbon dioxide, hydrogen, and methane. It is produced by the gasification of a carbon-containing fuel to form a gaseous product that has a certain calorific value. Examples of synthesis gas production include the gasification of carbon-rich compounds, gasification of various wastes, and steam reforming of coke.
It is a gas that is used as an intermediate product to synthesize other substances, which is why it is called synthesis gas. It is also an intermediate in the creation of synthetic oil for use as a lubricant or fuel.
Main Contaminants in Synthesis Gas
Synthesis gas contaminants are composed of tars, nitrogen-based compounds (NH3, HCN, etc.), sulfur-based compounds (H2S, COS, etc.), hydrogen halides (HCl, HF, etc.), and trace metals (Na, K, etc.).
The presence of these contaminants in the synthesis gas poses several technical and operational problems ranging from corrosion (H2S) and fouling of equipment (tar), deactivation of catalysts (tar, H2S, NH3, HCl, and trace metals), or environmental pollution (NH3).
Most downstream applications of syngas have very stringent requirements in terms of composition, so they have different levels of cleanliness requirements depending on their application. Therefore, contaminant levels must be reduced by cleaning the gas to meet the requirements of downstream applications.
Cleaning of Syngas
Cleaning the synthesis gas is an essential step prior to its further use. Cold gas cleaning is considered the most widely used cleaning method due to its proven reliability and high efficiency in removing contaminants.
The main characteristic of this method is that it is carried out at a low temperature, usually at room temperature or below.
In terms of cost, this approach is more suitable for large-scale applications due to the need to treat solvent effluents generated during gas cleaning. Since gasification is carried out at about 800°C, the main disadvantage of this method is the efficiency penalty paid due to stream cooling, in addition to the secondary cost of treating or removing contaminant streams.
Cold gas cleaning uses either dry or wet processes. Wet cold gas cleaning processes employ scrubbing towers, impingement scrubbers, Venturi, and electrostatic precipitators or cyclones. These units remove contaminants by absorption, adsorption, filtration, or a combination of these.
Wet gas scrubbing processes are the most used because they allow the removal of more contaminants.
For example, ammonium (NH3), hydrochloric acid (HCl), and hydrogen sulfide (H2S) are readily soluble in water. Therefore, scrubbers, scrubbers, and cyclones that use water as a solvent will remove all these contaminants, although with different removal efficiencies depending on their solubility in water.
Uses and Market of Syngas
MSW is a raw material that is not in short supply, widely available and is not susceptible to geopolitical risks, risks in commodity price fluctuations, or risks of natural disasters. As a waste product, it has no real competitive uses.
On the other hand, it is important to note the role of synthesis gas in the market. Throughout the chemical industry, synthesis gas is an intermediate product.
The ammonia industry dominates the world market for synthesis gas (mainly from fossil fuels such as coal, natural gas, and oil). Hydrogen production for use in refineries and methanol processing are other important applications.
Conclusions
Syngas is defined as a gas, rich in H2 and CO, the main fuel components. Its main properties are flammability limit and laminar flame speed.
Syngas is produced from biomass/coal gasification or natural gas reforming, and the yield is measured by the mass of product produced per mass of feedstock.
The Fischer-Tropsch technique is one of the commercially available methods for making clean synthetic fuel from syngas.
On the other hand, products such as methanol, dimethyl ether, ammonia, etc. can also be produced from syngas.
Many industry newcomers feel a washer and a gasket are the same as both of them consist of a similar design and both are used in conjunction with other objects. Even though their looks are quite similar, both washers and gaskets are used for completely different purposes. In this article, we will learn the major differences between a gasket and a washer.
What is a Washer?
A washer is a disc-shaped thin plate having a hole in the center. Washers are generally used as a fastener along with nuts or bolts for the purpose of distributing the load. The hollow center of the washer is inserted into the bolt and then the nut-bolt arrangement is tightened. The washer then distributes the bolt’s load across its disc-shaped surface.
Washers are manufactured in various types like:
Plain washers
Spring washers
Cupped washers
Toothed washers
Locking washers
Torque washers
Tab washers
Wedge lock washers
What is a Gasket?
A gasket is a sealing element between two bodies. They are used to prevent leaks around the two mating surfaces. The irregularities of machined surfaces are filled by the gasket to prevent leakage. Click here to learn more about various types of gaskets and their working.
Depending on the application, they are manufactured into various types like
Washers vs Gaskets: the Differences between Washers and Gaskets
From the definition mentioned above, it is quite evident that both washers and gaskets are completely different items with different purposes. The major differences between a gasket and a washer are:
1.0 Washers distribute the loads applied on threaded fasteners while gaskets prevent leakage of fluids through flanged joints. Gaskets are used for sealing applications with flanges or valves whereas washers are used with nuts and bolts.
2.0 To distribute loads, the washers need to be rigid. On the other hand, a rigid gasket will not work as required.
3.0 Gaskets are manufactured in a wide variety of shapes and sizes whereas washers are normally made of uniform circular shapes. The central hole of the washers is small to fit into the bolts. The gaskets also have a central hole which is larger as compared to washers.
4.0 In general, washers are made from metals. On the other hand, gaskets are available in metals, metal alloys, non-metals like rubber, and other synthetic materials.
5.0 Sometimes a sealant is used with the gasket to improve its performance and longevity. But sealant is not used with washers.
Colors of Hydrogen: Green, Blue, Grey, Black, Brown, Pink, Turquoise, Yellow, Red, and White Hydrogen
We all know that Hydrogen is an invisible gas without any color. But still, we find people talking about different colors of Hydrogen. They usually talk about Green Hydrogen, Blue Hydrogen, Black Hydrogen, Brown Hydrogen, Pink Hydrogen, Turquoise Hydrogen, Yellow Hydrogen, Red Hydrogen, and White Hydrogen. So, what are these colors? In this article, we will learn about different types of Hydrogen colors and their meanings.
Colors of Hydrogen
As hydrogen atoms don’t exist on their own, they need energy to produce hydrogen. Hydrogen is highly abundant in form of water or natural gases but to create pure hydrogen, one needs to break those molecular bonds using some form of energy.
Depending on the process of how Hydrogen is produced, it is provided with 9 color codes. They are:
Green Hydrogen
Blue Hydrogen
Grey Hydrogen
Black or Brown Hydrogen
Pink Hydrogen
Turquoise Hydrogen
Yellow Hydrogen
Red Hydrogen, and
White Hydrogen
This color coding is unofficially provided by North American Council for Freight Efficiency (NACFE). However, still, there is no universal naming convention for the above hydrogen colors which may change in the future over time or even between countries.
Green Hydrogen
The name green hydrogen is given to the hydrogen produced using clean electricity from surplus renewable energy sources to electrolyze water. As this production method does not produce greenhouse gas emissions, the production of green hydrogen is environmentally friendly and sustainable. A device called an electrolyzer is used to produce green hydrogen.
Electricity generated by renewable sources like wind, solar, etc split the water into its components i.e Hydrogen and Oxygen using an electrochemical reaction. Thus the process emits zero carbon and helps in the net-zero carbon philosophy. As the production of green hydrogen is costly, it makes up only a small percentage of the overall produced hydrogen.
Blue Hydrogen
Blue hydrogen is generated using the steam reforming method of natural gas (Fossil Fuel). Natural gas and heated steam are brought together which produces hydrogen and carbon dioxide. This carbon-di-oxide is stored underground for industrial use using Carbon Capture and Storage (CSS) technology. As the steam reduction process does not avoid greenhouse gas creation, Blue hydrogen is also known as low-carbon hydrogen.
Grey Hydrogen
Grey hydrogen is the most common form of Hydrogen that is produced from natural gas, coal, or methane. A method called steam methane reformation is used for creating grey hydrogen. A smaller amount of greenhouse gases are also generated while producing grey hydrogen but those are not captured and released into the atmosphere.
Black or Brown hydrogen
Black and Brown Hydrogen is produced from black coal or brown coal (lignite). This type of hydrogen production is the most environmentally damaging. Most hydrogen produced in the United States is “brown hydrogen”. The steam-methane reforming process is used to create black and brown hydrogen. In this process, steam is used to split natural gas or coal into clean, zero-emission hydrogen fuel and CO2 gas.
Pink Hydrogen
When hydrogen production is done by the water electrolysis process which is powered by nuclear energy, the generated hydrogen is termed pink hydrogen. Sometimes, this hydrogen is also termed purple hydrogen.
Very high temperatures of nuclear reactors are used in this process which is highly efficient.
Turquoise Hydrogen
Turquoise hydrogen is produced using the methane pyrolysis process. Natural gas is broken down using the thermal process to create hydrogen and solid carbon. The thermal process to split the natural gas is powered by renewable energy and the generated carbon is permanently stored or used.
Yellow Hydrogen
When solar energy is used for the electrolysis process to generate hydrogen, It is termed yellow hydrogen. This method of hydrogen production is relatively new. Sometimes, various other mixed energy sources are also used to produce yellow hydrogen.
Red Hydrogen
A high-temperature catalytic process is used to split water with nuclear thermal power and the generated hydrogen is termed Red Hydrogen.
White Hydrogen
White hydrogen is the naturally-occurring geological hydrogen. This type of hydrogen is usually found in underground deposits. Sometimes, white hydrogen is created through fracking. At present, there are no strategies to exploit this hydrogen.
All the above discussions can be summarized in a tabular format as provided below:
Hydrogen Colors
Production Process
Green Hydrogen
Electrolysis of water using clean electricity from renewable energy sources.
Blue Hydrogen
Steam reforming of natural gas using CSS technology
Grey Hydrogen
Steam reforming of natural gas without CSS technology
Black and Brown Hydrogen
Steam reforming of black or brown coals
Pink Hydrogen
Water electrolysis using nuclear energy
Turquoise Hydrogen
Methane pyrolysis
Yellow Hydrogen
Electrolysis using solar power
Red Hydrogen
High-temperature catalytic process using nuclear power
White Hydrogen
Naturally occurring Hydrogen
Table 1: Colors of Hydrogen and Production Process
Blue Hydrogen vs Grey Hydrogen
The production of Blue and Grey hydrogen is almost similar. The main difference between the two processes is that in Blue hydrogen production, the greenhouse carbon-di-oxide gas is captured using CSS technology whereas in the Grey hydrogen production process the CO2 is not captured.
Blue hydrogen is an alternative low-carbon hydrogen production process but Grey hydrogen is not considered a low-carbon fuel.
Is Hydrogen a Clean Energy Solution?
As discussed above, most hydrogen production processes are not a solution to clean energy. However, green hydrogen is fully clean energy but the production process is costly. Green hydrogen is produced following the zero carbon emissions process and fully clean energy.