The full form of FPSO is Floating Production Storage and Offloading. These are floating vessels over the sea used for the production, storage, and off-loading of crude oil. FPSOs are very important as it facilitates the processing and storage of oil and gas. Extensively used by the offshore industry, FPSOs are one of the primary methods of oil and processing as well as storage. In general, they are leased by oil and gas companies.
The vessels contain various processing equipment that helps in the separation, storage, and offloading of crude oil and gas that is extracted from sub-sea oil wells or platforms. After processing the oil and gas, FPSOs store it safely it is offloaded onto a tanker or transported through a pipeline. In the year 1977, Oil and Gas major, Shell built the world’s first FPSO.
Advantages of FPSO
In recent times, the FPSOs have become more vital for the oil and gas industry due to the fact that onshore oil discoveries have started to decline. There are 270+ FPSOs that are successfully operating around the globe. The main reason behind their utmost popularity is that they are flexible, efficient, safe, and way cheaper as compared to traditional offshore oil and gas platforms. Other benefits of FPSOs are:
- FPSO provides wide flexibility in operation. Any pipeline can be connected to an FPSO. They can be moved to other locations easily. Permanent structures and pipelines are not required. All these reduce the total cost of FPSO systems as compared to the conventional methods.
- A substantial amount of processed oil and gas can be stored in an FPSO.
- FPSO systems provide better safety as compared to conventional processes.
- The time requirements for FPSO solutions are significantly smaller.
- Highly effective in deep water and remote locations, where seabed pipelines are not economic.
- FPSOs are extensively suitable for smaller oil field as the need to lay long-distance expensive pipelines are eliminated.
- FPSOs provide cost-effective maintenance.
Components of an FPSO
Let’s explore the main components of an FPSO. The major parts of an FPSO are:
Hull
The hull of an FPSO is the topside of the ship above sea level. They are usually newly built or made by converting from existing tankers with the specification needed to match the project-specific conditions. which differ depending upon the regions as well as the standards defined.
Mooring System
They are the equipment that holds the FPSO in place against forces, waves, winds, and currents. Mooring systems play an important role in supporting the safe operation of FPSOs. They are made up of mooring lines, anchors, and connectors.
Topside
It’s the oil and gas processing unit at the top. Which are designed and constructed under fixed offshore platforms and refinery standard specifications as per API & ASME. It should also consider the loading due to wave action. As sit has a serious effect on the fatigue life of the equipment.
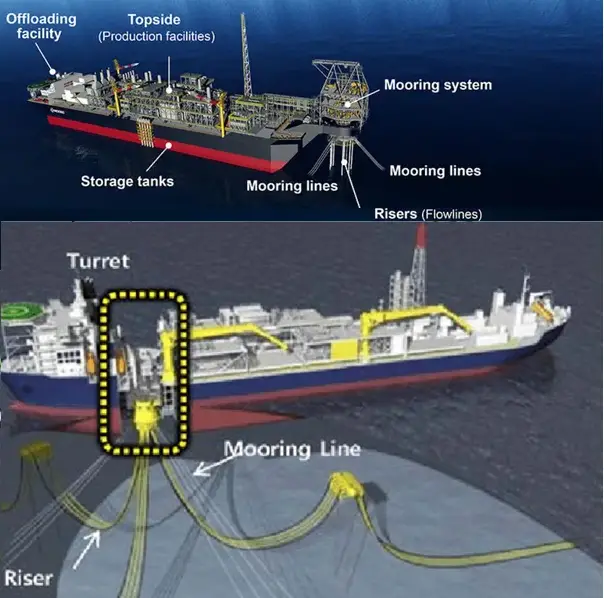
Risers
This permits the FPSO to move both vertically and laterally. This connection to the subsea wells is made through flexible steel reinforced risers. They are designed to absorb any motion which affects the position of the vessel by waves. Swivel stacks are used to transmit well streams from the turret to the topside while the ship rotates. It also conveys gas for injection back into the reservoir to provide pressure support.
FPSO Turret
The turret is integrated into the FPSOs hull. The turret thus helps the hull to weathervane around the mooring system and the mooring line. For harsh weather conditions, a turret mooring system is critical. Using the turret the FPSO can rotate freely while moored to various locations on the seafloor.
Detachable FPSO turret
Sometimes detachable turret systems are used. This is useful to disconnect from the vessel while being attached to the mooring system on the seabed. During hazardous situations like storms, the vessel can quickly react by detaching the turret system, and once the threat alleviates, they can reattach and start operation. So, a detachable turret system essentially increases the flexibility of the system.
There are some other components that are part of the FPSO system as listed below:
- Gas Dehydration System
- Gas Compression System
- Water injection FPSO Components
- Gas, water, and oil separator
- Seawater Treatment Unit
- Process and Utilities
- Power Generation Unit
- Separation Trains
- Sea Water Treatment Unit
- Gas Compression and Metering Unit
- Gas Treatment Unit
- Produced Water Treatment Unit
- Water Injection Unit
- Chemical Treatment Unit
- Utilities
- Hull and Marine Utilities:
- Cargo
- Propulsion
- Storage
- Ballast
- Boilers
- Accommodation and Central Control Helideck
- Turret and Fluid/Control Transfer Swivel
Working Principle of an FPSO
Hydrocarbons (mixtures of oil, water, and gas) produced in the subsea wells are carried onboard through subsea pipelines, flexible risers, etc. These hydrocarbons in the process get separated into oil, water, and gas at the topside production facility (which consists of water separation, gas treatment, oil processing, water injection, and gas compression.
From the turret, the hydrocarbons move on to the inlet production and test manifold. Which is consisting of modules like crude separation module, gas separation module, and water separation module.
Each separation module is having different equipment as per the process conditions. The oil separation consists of,
- Crude separation module: This consists of a sand filter, slug catcher, and production separator.
- Crude stabilization module: having electrostatic coalescer- desalting/dehydrate, LP separator, and LLP separator.
- Crude oil storage and offloading system: module consisting of an oil cooler and storage tank for storing and offloading of the oil.
Gas separation includes,
- Gas low-pressure compressed module
- Gas medium pressure compressed module
- Gas high-pressure compressed module
All three modules have a cooler, scrubber, and compressor in common.
The water treatment module has,
- Sand filter
- Hydro cyclone
- Degasser
- Cooler
Separated crude oil after processing gets stored in storage the tanks will get loaded onto shuttle tankers moored at the stern. The gases from the hydrocarbons can be used as fuel for vessels, gas turbine power plants, or else transferred through pipelines onshore.
What is an FSU?
A Floating storage unit (FSU) is a type of simplified FPSO without the scope of oil and gas processing on the board. FSU units are used to store and offload the processed oil and gas to the refineries. The processed oil and gases will be stored in large silos placed over the top of the vessel.
Difference between FSO and FPSO
The main difference between FSO and FPSO is that FPSO is concerned with production as well as storage whereas the main function of FSO is mainly storage.
Disadvantages of FPSO
Though there are many benefits of an FPSo system, it has some limitations like:
- High initial cost.
- It may take up to two years to convert a tanker into FPSO.
FAQs related to FPSO
What is the biggest FPSO in the world?
Based on capacity, Total’s Egina FPSO is the biggest FPSO in the world. It has a capacity of 2.3 million barrels of oil. This FPSO is situated in the Egina field in Nigeria.
Is FPSO a ship?
FPSOs are floating vessels. they are made by converting a former supertanker into a new purpose-built vessel. They are ship-shaped but with other processing parts. The tanker will be idle over the place till the production facility produces enough oil. The vessels can also be moved from one place to another after the field has been depleted.
Does FPSO drill?
Apart from commonly used FPSO, additionally built FDPSO (Floating drilling production storage and offloading vessel) incorporates deepwater drilling equipment which will help to develop the field and can be removed and reused after the production wells are drilled.
How are FPSOs moored?
The FPSO is usually anchored to the seabed, Anchor spreads usually consist of wires and chains which get tensioned by winches within the turrets. Mooring lines consist of 6 to 10 chains or wires. They get moored by a mooring system within a wide range of water depths, From deep as 20m to 2000m. They contain a spread of 8 to 14 anchors to ensure that the FPSO remains on location. Conventional anchors, suction anchors, or piles are used to make the connection with the seabed.
The mooring lines get connected to the hull by the turret system using giant rotating bearings.
Different mooring systems available are
- Internal turret: often used inside the hull. Used up for severe marine conditions and where cyclones are severe.
- Disconnectable turret: it can detach from mooring systems and be evacuated to a safe distance. Whenever there are severe weather conditions.
- External bow-mounted turret: used up for severe monsoon regions
- Tower yoke: used in shallow waters.
- Catenary anchor leg mooring is installed in areas where sea conditions are moderate.
What is a turret in FPSO?
Turrets inside the FPSO are integrated into the hull at the center of the ship. it contains a bearing system consisting of giant rotating bearings which connect the mooring to the turret. These reduce external forces like waves, winds, and currents on the FPSO by freely rotating around the turret and performing stable oil and gas production. It also allows the vessel to rotate around the fixed part of the turret. Moorings are attached along with the fluid transfer system that connects pipelines to the FPSO for processing.