Stub-in and Stub-on are methods for making a fabricated branch connection from the pipe. Both types are permitted by many international codes and standards, including ASME B31. However, both of these are weak connections on piping systems and are normally limited only to low-pressure and temperature applications. In this article, let’s explore the differences between Stub-in and Stub-on branch connections.
What is Stub-In?
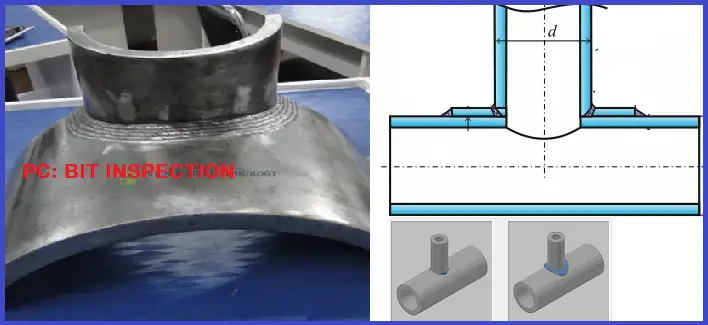
In the case of a stub-in, a larger hole is drilled in the header or run pipe, and a branch pipe whose end is contoured similar to the inside diameter (ID) of the header is fitted inside the hole. Then both the stub-in branch pipe and the run pipe are welded together to form a connection similar to reducing tee. Stub-in is normally used when the branch is more than one size smaller than the main pipe. For the “stub in” connection, the branch pipe extends to the inside of the main pipe. Stub-in connection is also known as the set-in connection.
What is Stub-On?
On the contrary, In the case of a Stub-On branch connection, the hole that is cut in the run pipe is the same as the inside diameter (ID) of the branch Pipe (Not the Header). The end of the branch pipe connection is contoured the same as the outside diameter (OD) of the header pipe and is then fitted outside the hole on the header pipe. It looks like the branch is seated “onto” the header pipe. Stub-on is generally used when the branch is equal to or one size smaller than the main pipe. For “stub on,” the stub extends only to the outside of the main pipe. A stub-on connection is also known as a set-on connection.
Additional Features for Stub-In and Stub-On
Both stub-in and stub-on branch connections can be made with or without a reinforcing pad as per requirement. This requirement is normally governed by pressure and stress criteria. The reinforcement pad is basically a ring that is cut from the run pipe or from a plate with the same material as the run pipe. At the center of the pad, a hole is made (the size the same as the branch pipe). When it is cut from a flat plate, it is contoured to fit around the run pipe. The width of the reinforcement pad is normally one-half the diameter of the branch pipe.
The aim of this reinforcement is to substitute the material that was removed for making the branch connection from the header. A small-diameter hole, known as a weep hole (1/4″ NPT) is normally drilled in the pad, which acts as a vent during the welding process for the weld-generated gases to escape. Using full penetration welds, The ring or pad is then welded to the branch and the run pipe. Once, the work is completed, the small hole is fitted using a plug.
Both the stub-in and Stub-on connections, in a sense, reduce the cost of pipe fittings. It saves installation time as well because only one weld is required around the stub hole instead of three welds that are needed for joining welding tee connections.
The welding strength of the Stub-in connection is as good as butt welding but welding steps are difficult in actual conditions. So Stub-in is comparatively stronger than stub-on connections.
Stress Considerations for Stub-in and Stub-on Connections
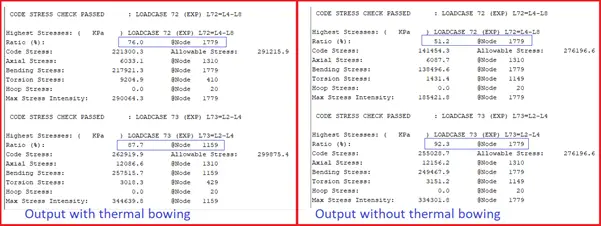
From the piping stress analysis considerations, the calculated SIF of stub-in and stub-on connections is much higher than weldolet fittings and ASME tees, which is significant when a detailed stress analysis is done on the system. While analyzing, extra caution needs to be considered as the stress generated will be higher. The use of this type of branch connection is not preferred for severe cyclic applications, high-pressure temperature applications, or category M fluid service applications.
Stub-in vs Stub-on Piping Connection | Differences between Stub-in and Stub-on
The main differences between a stub-in and stub-on branch piping connection are tabulated below:
| Stub-in pipe Connection | Stub-on branch connection |
| As explained above, Stub-in is used when the run pipe and branch pipe have a difference of more than one size. | On the contrary, a stub-on pipe branch connection is applicable when the branch pipe is equal to the run pipe or only one size lower than the header pipe. |
| In the case of the stub-in branch connection, the pipe welding between the branch and header is of butt-weld type. This welding is quite difficult. | Stub-on branch connections are made using fillet welds. Welding is easier as compared to the stub-in welding method. |
| A stub-in piping connection is able to withstand more pressure. | Stub-on branches are comparatively weaker than the stub-in branch connection and hence handle less pressure. |
| The branch edge of a stub-in connection matches the internal pipe diameter of the header. | For stub-on branch connection, the branch edge lies on the outside diameter of the header. |
| Stub-in pipe connections usually have more weld strength value than sub-on branch connections. | Stub-on pipe branches possess comparatively less weld strength value. |
Few more Resources for you..
Briefing about Reinforcement Pad
Piping Design and Layout
Piping Materials
Piping Stress Analysis
Piping Interface